

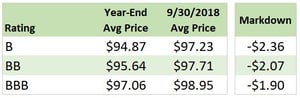
Loan market participants enter 2019 looking back at a miserable December. Senior secured loans traded off the most since early 2016. BB-rated loans were trading below $96.00 for the first time in the three-year span and nearly all loans fell below par.
 BDC equity took a beating in line with US equities, but unlike liquid credit markets, the extent of the pain may not yet be clear for BDCs. Given most BDCs won’t file earnings until February, the true extent of the damage is still unknown. The best way to gauge the impact of the market stress on BDCs before they report it themselves is to aggregate data from a number or sources and analyze from various different angles. This initial analysis starts with the following four approaches:
- Performance of the liquid portion of BDC portfolios in Q4 2018
- Historical analysis of past selloffs and subsequent BDC asset markdowns
- Gauging the increased impact to subordinated investments
- Review of sector-specific loan markdowns
What happened to semi-liquid portions of BDC portfolios?
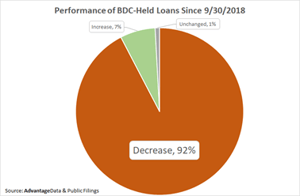 Applying evaluated pricing to BDC-held loans is a good first step to see what a future quarter may bring. Approximately 15% of BDC-held loans have active evaluated pricing supported by secondary market activity from Advantage Data’s loan pricing service as of 12/31/2018. Of those loans in BDC portfolios that had market bids or other secondary observations, 92% of them had decreased in value during Q4 2018.
Over two-thirds of these markdowns ranged from -1 to -5% of par value which is largely in line with the broad liquid loan market, however 1 in 20 loans had a more severe decline of over 5% in the quarter. Isolated credit issues continue to certain portfolio companies, but absent an abrupt increase in default rates, the story as of this upcoming filing season will be the impact of the loan selloff on portfolio fair valuations and thus NAV.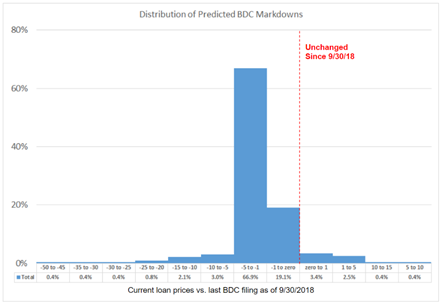
While we recognize senior loans are not an entirely homogeneous asset type, applying the decline in evaluated pricing across an entire portfolio of senior loans would result in a 3.2% markdown. Given the lower levels of liquidity and different approaches to level 3 asset valuation, it is important to look beyond the liquid portion of the market to draw further contextual evidence out of the available data. For that, we can turn to historical analysis.
Download the full report below
Read the full report by downloading the PDF. In the report, each of the four approaches are used to reach conclusions about what to expect from the next round of BDC filings in 2019.

Advantage Data provides ongoing research on the BDC space and broader credit markets. For more information, to request research, or learn more about our workstation and valuation offers please reach out to our Boston-based team.
.png)


