
Going Nowhere
Often, after the completion of a BDC earnings season, we are witness to sharp price adjustments. After taking the health of nearly four dozen different funds in a very short period, analysts and investors often reach for the Buy or Sell button.This frequently results in a re-pricing of the entire sector, sometimes favorably and sometimes not. This week was a little different. Looking at the multiple data points that we do every week, we conclude that market participants did not do much in the way of re-thinking.
Outliers
Of course – as in all things – there were a few exceptions. Three BDCs moved more than 3.0% up in price on the week.
Highly popular NEWT hit a new high intra-week of $24.24, and closed up 7.2% on the week even after closing slightly lower by week’s end. The unusual BDC now boasts the highest premium price to book value amongst the 46 public BDCs we track: 55%! Over a 52 week period NEWT is a huge success story, up 39.5% in price alone.
Also up – but the very antithesis of NEWT – was MCC, up by 5.8% on the week, but down by 39% over 52 weeks. The market – absent a Proxy but filled with mild optimism – revalued the BDC based on its proposed merger with Sierra Income and Medley Management (MDLY). Hope springs eternal, etc.
Finally, that other massive under-performer ABDC was up 4.4% on the week, but remains 39% down over 52 weeks and much more below it’s all-time high or IPO price. Again, investors are seeking to price a BDC very much in transition, which trades at a 42% discount to book.
Cutting Edge
For the BDC Reporter, both MCC and ABDC are classic “falling knife” scenarios. Investors who boldly reach out at this point may turn out to be heroes or goats, but much will depend on a mix of factors too difficult for any outsider to wrap their analysis around.
This is standard issue speculative investing and we wish everybody involved good luck. For our part, we folded our MCC tent on reviewing the merger terms and our portfolio analysis of ABDC left us where we were before: on the outside looking in.
With The Exceptions Out Of The Way
Otherwise, most of the BDC Reporter’s weekly metrics were – in most cases – little different than the week before.
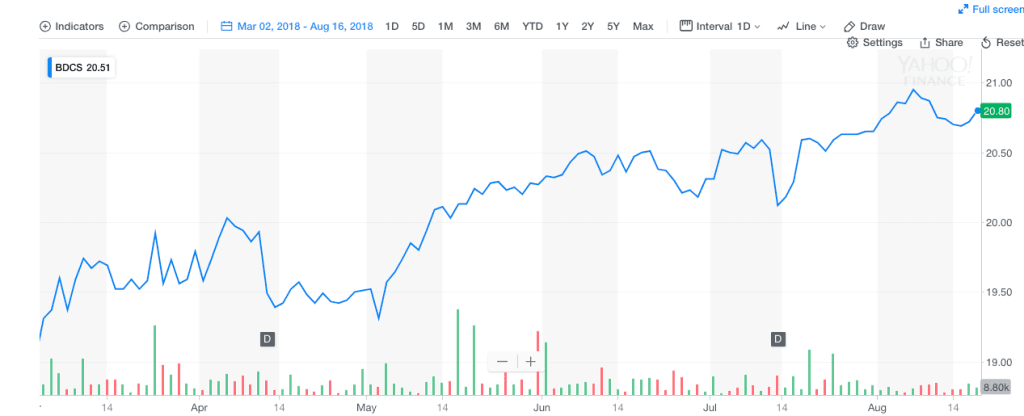
The price of BDCS increased by 5 cents a share to $20.80 from $20.75 the week before. This was notable mostly because BDCS broke above the year end 2017 level (December 29) of $20.76. That’s a milestone of sorts.
Other Data Points
When we look at 50 Day and 200 Day Moving Averages – as investors are wont to do – we find very little different from week to week.
This week 32 BDCs are trading above their 50 Day Average, versus 33 last week. On the other hand, 35 BDCs are above the 200 Day average versus 34 the week before.
We also note that exactly the same number of BDCs (14) are trading at prices equal or above book value as there were on August 10.
Our own favorite metrics – tracking how many BDCs are trading within 5% of their 52 week highs and lows – were pretty stable. Last week we had only only 2 BDCs trading within 5% of their one year low. This week: 3.
Bottom Feeders
Interestingly, only 1 of the 3 has been under-performing from a financial standpoint (MVC). Both the other two denizens of the BDC basement (SUNS and CGBD) by this measure have mostly met expectations. In fact, SUNS trades at book value and CGBD just 5% off, and both have maintained their distributions.
As usual, the market is looking ahead and re-valuing both franchises. At the other end of spectrum, we count 14 BDCs trading within 5% of their 52 week high versus 15 last week.
Bigger Picture
Pulling back a little from all this minutiae, we see in the chart below that the BDC rally has been motoring along since March 1, 2018.
We’ve been up as high as 10% off that March 1 nadir, and are currently 9.2%, with a clear upward trend. Any downward trend has never lasted more than 8 calendar days from our review of the chart and the price of BDCS has not dropped more than 3.5% sequentially before reversing course.
Outlook
We’ve been having some success in recent weeks, or even months “calling” this BDC sector rally. It’s been a good time for BDC investors to be long the group as a whole and most of its constituent components.
Moreover, dividends – as we cover in great detail in the BDC Reporter’s Premium Edition – have been steady as well. Even BDCs reporting poor or very poor results in the period (MCC, BKCC, TCRD and FSIC come to mind) have continued to pay an unchanged payout.
On a price basis, BDCS has out-performed the Dow Jones and S&P 500 index in the period, and is running neck and neck with NASDAQ. On a Total Return basis, there’s no contest with the BDC sector well ahead of those well know market indices. This is no mean feat as over the years BDCS – on a price performance basis – has lagged far behind these indices. For example, over the last year BDCS is down 2% in price terms while NASDAQ et al. are up between 17%-26%.
Fingers Crossed
So – at the risk of jinxing ourselves and breaking our predictive streak – we continue to believe the BDC market goes higher. In this regard we don’t have any different rationale than the week before.
In fact, we’ll close by shamelessly quoting from last week’s final comments:
- We expect that the siren song of higher revenues, higher earnings, fatter dividend cheques and very low bad debts will continue to appeal to existing and prospective BDC investors.
- (We won’t mention changes in the rules that would allow BDCs to rejoin the major indices because we’ve heard nothing new this week).
- Despite those ever higher numbers of BDCs closing in on 52 Week Highs, there’s still plenty of ways to go for this rally.
- As always – and as demonstrated by the drop in the Wells Fargo BDC Index and in BDCS this week – the path is unlikely to be smooth, but the likely future direction is up.
By Nicholas Marshi, BDC Reporter
BDC Common Stocks Market Recap: Week Ended August 17, 2018
Posted by
Nicholas Marshi, BDC Reporter on Aug 22, 2018 9:51:20 AM
Topics: Middle Market, BDC, market analytics, Fixed Income, portfolio, News
Are you using AdvantageData?
AdvantageData is your fixed income solution for pricing, analytics, reports, and insight on approximately:
- 500,000+ U.S. and international corporate bonds
- Over 6,200+ CDS reference entities
- Over 22,000+ syndicated loans
- Over 100 equity markets worldwide
- One platform 16 products and services from debt to CDS to loans to mid-market
- Used by top buy and sell-side firms worldwide
.png)


