
Treading Water
Another quiet week – as you might expect in August – for BDC common stocks.
The headline number – the price of the sector-wide UBS Exchange Traded Note with the ticker BDCS – was down. BDCS closed at $20.69, following a mostly downward sloping week.
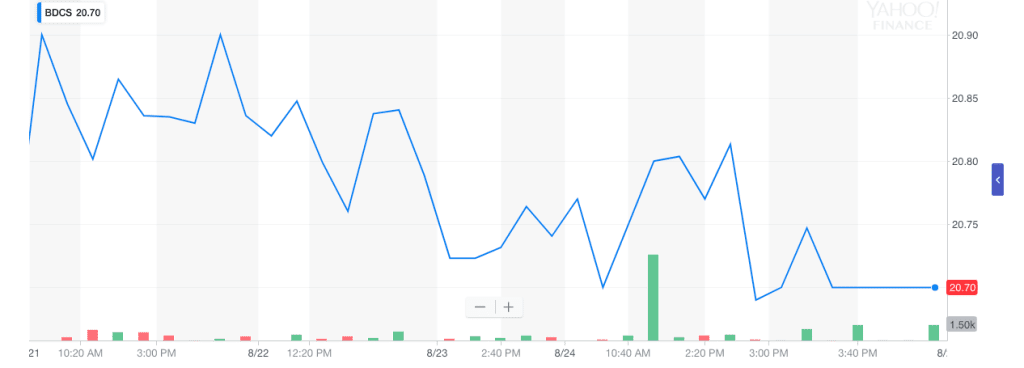
Still, that’s just a 0.5% drop following just a 0.2% gain the week before. Volume of share trading in BDCS, with that one inexplicable spike that shows on the chart, was anemic.
As Before
Moreover, most of the other metrics the BDC Reporter reviews weekly were little changed. Like the week before, 27 of the 46 BDCs we track were up or flat on the week.
When we look at how many BDCs price ended the week above their 50 Day Moving Average the number was also the same as the week before: 32.
When we use a 200 Day Moving Average as a threshold, the number above increased by just one this week over last to 36.
We also look at how many BDCs are up/flat in price using the slightly longer time frame of 4 weeks to get a clearer picture of sector direction.
Again – and we know this is dull as dust but it’s the point – there were 30 BDCs in the green – same as the week before.
Even when we look at how many BDCs are trading within 5% of their 52 Week Low and 52 Week High – one of our favorite early detectors of stress – there is little change.
Same Laggards
Like last week, 3 BDCs are trading within 5% of their 52 Week Lows. Yes, that’s the same three BDC names as last week (MVC, SUNS and CGBD).
On the sunnier side of the street, there are now 15 within 5% of their 52 Week High, up from 14 last week and 15 the week before that.
Thank-You
If for no other reason than to give the BDC Reporter something to write about, there was a little price volatility in a handful of names.
The Biggest Loser on the week was ABDC, which was the only BDC to exceed our 3% loss limit, and was down 4.8%.
The market has been having a hard time – and with good reason given multiple uncertainties – deciding itself about how to price the alphabetically first BDC.
Here is the chart since ABDC reported IIQ 2018 results on August 6. As the chart shows, first we went down, then moved up – ever so briefly – to a new high only to drop back again.
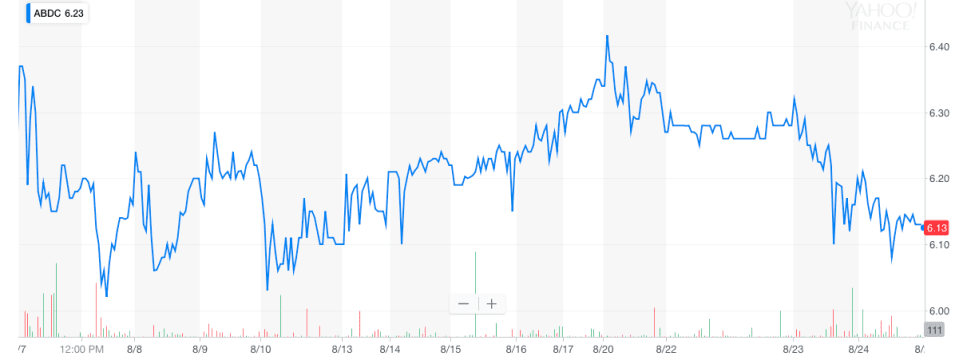
A definitive move either up or down probably won’t occur till we learn more about how the new management team, strategy and economics of the BDC are faring.
Not to mention what credit quality is looking like.
Troika
On the plus side, there were 3 BDCs up 3.0% or more.
Top of the list was OHAI, up 4.8% and still – as we’ve been pointing out for months/years – more of a short term speculation than anything else ($0.02 quarterly distribution !).
This is a very hard one to call. Over 4 weeks the price change is exactly 0% !
GARS was up 3.4% on the week and 4.2% over 4 weeks, and 7.9% since June 27, 2018 when the upward trend began.
We expect investors are bidding up the already highly leveraged BDC on anticipation of better results once the balance sheet grows with the recent shareholder approval of higher leverage.
The BDC has even offered to reduce that portion of its Management Fee over the prior regulatory limit.
Not hurting the BDC’s case is an almost squeaky clean credit portfolio right now, with only 2 Watch List names.
One is on non accrual and has been written down sharply already (Profusion Industries) and the other is a non income producing investment in an oil & gas company (Rooster Energy).
Contrarian
Not to be a party pooper, but the BDC Reporter has been crunching the numbers and is less sanguine that much in the way of higher earnings/distributions are ahead.
This is not the place for an extended discussion but we can sum up our reservations this way:
GARS does not have a credit but an earnings problem.
Higher leverage will mitigate but not solve the problem while laying up further credit risks down the road.
The BDC came public only 5 years ago, but has booked Realized Losses equal to a quarter of its par equity capital.
In an attempt to ensure that does not continue/happen again, management has shifted into lower risk loans, for which shareholders should be grateful.
However, with lower risk comes lower yield and as the last double digit yielding assets are paid off/refinanced and replaced with lower yielding loans, earnings are squeezed.
Last quarter, the average portfolio yield was 9.7% (down from 10.2% a year ago).
However, as mentioned on the latest Conference Call, newly originated loans in the quarter averaged a 9.0% yield and a bevy of syndicated loans paid just 7.3%.
By contrast loans repaid were yielding an average of 11.3%.
Further Analysis
We counted 11 performing loans still on the books yielding 9.0% or more with a value equal to 20% of yield producing assets.
What GARS will be gaining on the metaphorical swings of higher assets will be getting lost in the roundabout of lower portfolio yield, in our view.
Maybe the market knows all that and is marking up the stock to reflect the lower risk portfolio and (in their view) the likely more stable dividend.
Nonetheless, given that GARS is temporarily not earning an Incentive Fee, we still believe there’s a fair chance we’ll have a dividend reduction before a dividend increase.
Moreover, we shudder at the Investment Advisor’s plan to target debt to equity (on a GAAP basis, not a regulatory one) of 2:1.
Coming Up
Finally PSEC was up on the week and has also been trending upward for some time (since May 3, 2018) and is up nearly 13% in that time.
We’re guessing PSEC optimists are positioning themselves in anticipation of good results when the controversial BDC reports results on August 28, 2018. See the BDC Earnings Calendar for details.
Maybe somebody knows something we don’t, or it’s just a matter of backfilling a discount that had risen to 32% of book (22% currently) ?
We have no deep analytical insights on offer.
Just a gut feeling assembled from a variety of items that buyers of PSEC might be disappointed when the actual results come out next week.
We shall see and report back.
After all, PSEC remains one of the largest – if not the largest – retail owned BDC out there.
Back To Our Crystal Ball
Looking forward, we expect the “wait and see” mode which has characterized the BDC sector in the last few weeks to continue till Labor Day.
Much of what happens after that will depend on market sentiment more generally.
The end of the bull market; the next recession and the like has been the drumbeat of financial news of late (the better things are, the more everyone worries).
We’ve been hearing repeatedly about concerns about a overheated leveraged loan market, but none of that is yet affecting high yield or syndicated loan pricing.
Even the recent increase in loan spreads has more to do with a temporary boost in deal supply than any real pull back by lenders.
That can change at any time and as the summer draws to a close markets may shift.
Overall, though, the BDC sector – judging by the fundamentals and leaving out the small number of Usual Suspects – is in pretty good shape and could still catch a second wind.
From where we are today, the BDC Reporter is still looking for higher BDC prices going forward.
.png)


