
BDC COMMON STOCKS
Back In The Saddle. Again.
It’s Week Two of the late 2018 BDC rally.
More than three-quarters of the 45 BDCs we track were up in price, just like the week before.
The price of the UBS Exchange Traded Note which covers most of the companies in the sector – BDCS – was up to $19.76.
That’s 2.0% on the week, and 5.0% over a fortnight.
The Wells Fargo BDC Index – which provides more of a total return picture – was up 2.7%.
Pointing In One Direction
And so on as most every datapoint we refer to weekly suggested a sector in “rally mode”:
Notably, 17 BDCs increased in price by 3.0% or more over the week ended Friday November 9, versus 14 the week before and exactly zero two weeks before.
Only 3 BDCs dropped by (3%) or more in price compared with a whopping 22 two weeks before.
By week’s end 17 and 21 BDCs respectively were trading above their 50 Day and 200 Day Moving Average.
The corresponding numbers – as the BDC sector reached its 2018 nadir in late October – were zero and four.
Moreover – and returning always to one of our favorite statistics plucked from the BDC Reporter’s own spreadsheet – the number of companies trading within 5% of their 52 Week Low dropped to 7 from 14 around Halloween.
What’s more, the number of BDCs within 5% of their 52 Week High moved up from 0 in late October to 5 this week.
Reasoning
Why – you may very well ask – are prices trending up after taking a 5 week beating ?
Were the second week of BDC earnings so impressive that investors were enticed back in to what they had previously spurned ?
Unfortunately for anybody hoping the BDC sector is uncorrelated to all the news about the price of oil, Apple, Tesla, Netflix, Ford, tariffs etc, the evidence suggests otherwise.
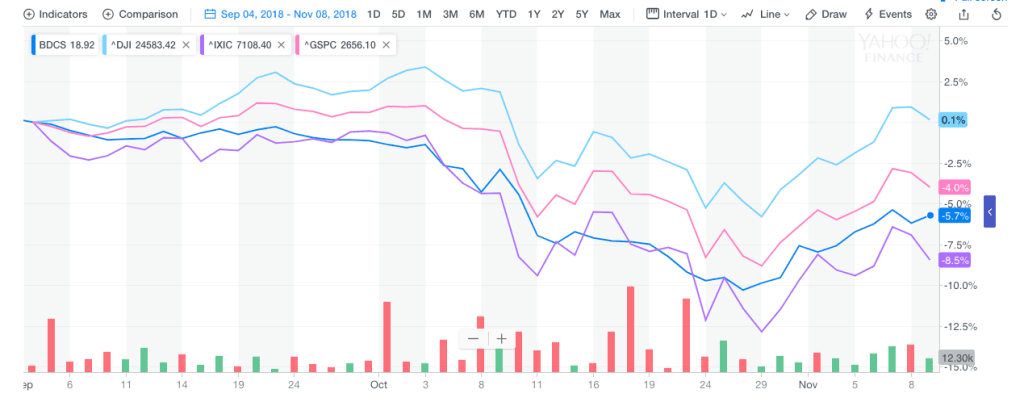
As this chart shows – coincidentally or otherwise – BDCS moved up in price in lock-step with the 3 major indices this week.

Even the shape of the upward trend largely follows what the three major indices were doing.
Devoted Follower
Pulling back a little and comparing the indices to BDCS from the end of August – when the rally peaked after months of gradual climb – we can see from this next chart that this week is part of a bigger trend.
One of our endlessly repeated contentions is that general market enthusiasms or disappointments trump any BDC sector fundamentals, even as the results are being posted for dozens of BDCs.
It’s A Good Thing
Strangely enough – as a perpetual investor in the BDC sector – we are delighted by this price volatility apparently unrelated to individual or sectoral performance.
It means some very good BDC stocks often come on sale out of the blue, and at discounts that would make even Macy’s blush.
Here are a few recent and longer term examples:
Much beloved Main Street (MAIN), which sometimes trades at an eye popping 60%+ premium to book in an industry where most participants dream of just reaching par – is a good place to start.
From late August to late October – just 2 months – MAIN’s price dropped more than (11%).
Then moved up 8% in a few days…
Likewise, market leader Ares Capital (ARCC) dropped nearly 9% in price from September and has now gone on an upward tear of 10%, above its earlier high.
Bigger And Better
However, these moves are nothing compared to the price changes when the markets really get filled with self doubt.
That same ARCC saw its stock price slide a dramatic (20%) between March 2015 and February 2016 even as its earnings and dividends – and outlook – hardly changed.
If the markets were getting ahead of the fundamentals, they must have gotten lost.
In any case, ARCC has since seen its stock price increase by 45% !
Nor was that the only time.
Euro Yoyo
Back in 2011 the markets worried about Europe and the future of the global economy.
ARCC dropped (22%) in price in a few weeks.
When the European bugbear was removed, the BDC moved up 36% in price over several months.
There Is A Difference
However, we do worry a little more about drops in BDC stock prices caused by real changes in performance.
This week, the headlines were hogged by Monroe Capital (MRCC), whose IIIQ 2018 results suggested credit problems were on the rise, and might extend beyond one or two loans having problems.
We’ve written about the MRCC situation at length , so won’t revisit all the details here.
Note, though, that in an upward trending market MRCC’s stock price dropped the most of any BDC over the Friday to Friday period: (9.0%).
Again, taking a somewhat longer view: if you’d bought MRCC at its highest high in June and sold at the recent low, the loss would have been (24%).
Misunderstanding ?
Management of MRCC have indicated the long standing $0.35 quarterly dividend is not at risk and the credit issues are just the normal ups and downs of a leveraged portfolio.
Many investors in these situations – burned in the past by similar reassurances that proved false – tend to shoot first and ask questions later.
After all nobody wants to be caught in a long descending situation where matters just keep on getting worse and worse.
BDC stock prices in those situations just have a life of their own, unrelated to the markets more generally.
Dystopian
Unfortunately, there are several BDCs caught in that down escalator for which there seems no escape.
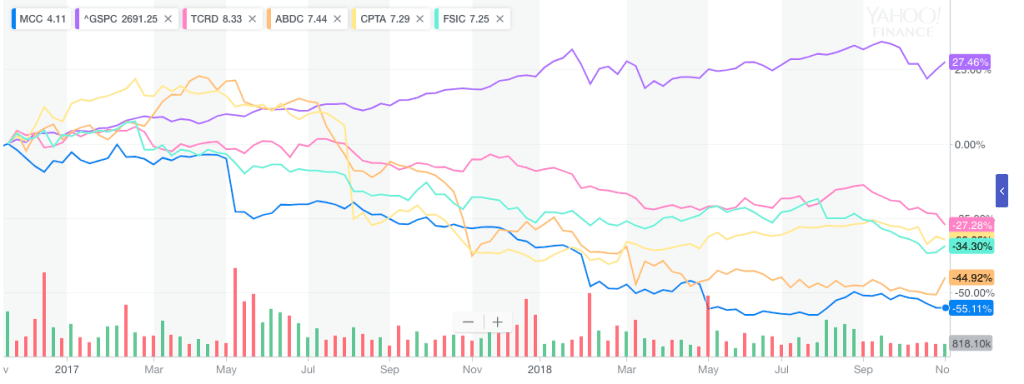
This chart shows a 2 year chart for Medley Capital (MCC), THL Credit (TCRD), Capitala Finance (CPTA) and Alcentra Capital (ABDC) and compares against the S&P index.
While the S&P 500 has bounced around for the short term, the upward trend is clear.
However, for the 4 BDCs with credit problems, the chart clearly illustrates the ineluctable descending slope, with price drops between 27% and 55%.
That’s a semi-exclusive club that no BDC wants to join.
Who Are You ?
It’s too early to tell if MRCC – whose historical credit, earnings and stock performance has been very good – is just having a bad quarter or two from a credit standpoint or something else is going on.
Also unclear is whether ABDC – which posted decent results in the quarter – and saw its stock price increase (from a low base) by 11.7% this week – will be able to escape its own downward trajectory.
Crux
To be successful in BDC investing – no easy task – one has to distinguish between temporary price drops based on non-fundamental issues such as swings in market confidence and a true build-up in credit problems.
That requires doubling down on quality stocks when the price is right and getting out of the way of the perennially credit challenged.
Easy to prescribe but hard to do.
Telling One From The Other
This passed week – with 22 BDCs reporting and 33 over the two weeks – question marks have been raised about MRCC, and to a lesser degree about FS Investment (FSIC) and Gladstone Investment (GAIN).
Everyone else – for better or ill – has performed as we would have expected.
That included Garrison Capital (GARS) which has only one loan on non-accrual, but still reduced its dividend as anticipated.
The BDC has been waiving some of its fees but does not want to continue to do so indefinitely, and reduced its payout prospectively.
Investors were clearly expecting the cut because the BDC’s stock price barely moved on the news.
When such cuts have occurred out of a clear blue sky in the past, BDC prices have dropped 10%-20% in reaction.
Upcoming
This coming week only OHA Investment (OHAI) – the smallest BDC – reports results.
We will have to wait till the end of November to fill in the entire BDC sector picture with 6 earnings releases still to come.
Will the rally continue ?
After all, the price of BDCS would have to increase 6.3% just to return to the August 30, 2018 high and 21% to the 2017 highest level.
Our suspicion – and it’s only a guess – that concerns about the end of the credit cycle and broader worries in the markets might moderate any further increase in BDC prices.
Whether that is justified by what’s happening to BDC fundamentals is what investors will have to decide for themselves.

.png)


