

BDC Filing season is almost over. This report will analyze BDCs that have filed in the last 3 weeks. Last week’s analysis is available here.
Aggregate Fair Value reported by BDCs that have filed in Q1 2019 is 104 Billion USD. BDCs have reported 36 Billion USD AUM in this week.
| Name | Number of Investments | Cost | Principal Value | Fair Value | FV Yield | Cost Yield |
| Ares Capital | 844 | 13,440,100 | 12,033,500 | 13,063,600 | 11.92 | 10 |
| FS KKR Capital Corp. | 341 | 7,792,600 | 7,126,806 | 7,440,200 | 25.58 | 12.93 |
| Owl Rock Capital Corp. | 139 | 6,840,793 | 6,853,862 | 6,831,712 | 9.34 | 9.32 |
| Prospect Capital | 199 | 5,949,069 | 6,105,176 | 5,700,673 | 68.29 | 12.34 |
| FS Investment Corp. II | 276 | 4,799,885 | 4,723,365 | 4,634,818 | 38.9 | 10.44 |
| FS Energy & Power Fund | 134 | 4,165,576 | 3,264,131 | 3,713,949 | 81.58 | 13.47 |
| FS Investment Corp. III | 252 | 3,809,962 | 3,718,069 | 3,671,558 | 16.35 | 11.32 |
| Business Development Corp. Of America | 322 | 2,641,046 | 2,719,828 | 2,528,816 | 30.71 | 12.77 |
| New Mountain Finance | 229 | 2,493,764 | 2,235,494 | 2,522,305 | 21.59 | 9.44 |
| Main Street Capital Corp. | 338 | 2,299,818 | 1,833,028 | 2,496,591 | 11.92 | 11.06 |
| Apollo Investment Corp | 264 | 2,494,391 | 2,765,537 | 2,444,412 | 10.74 | 10 |
| TCG BDC Inc. | 134 | 2,221,378 | 2,233,182 | 2,155,209 | 10.76 | 9.53 |
| Golub Capital Investment Corp. | 766 | 2,102,839 | 1,947,987 | 2,112,255 | 9.01 | 8.54 |
| Hercules Capital Inc. | 330 | 2,153,263 | 1,920,612 | 2,081,042 | 14.3 | 13.91 |
| Golub Capital | 809 | 2,028,871 | 1,858,829 | 2,031,163 | 9.05 | 8.65 |
| Bain Capital Specialty Finance Inc. | 193 | 1,920,159 | 1,565,697 | 1,913,609 | 8.77 | 8.53 |
| TPG Specialty Lending, Inc. | 71 | 1,825,719 | 1,783,254 | 1,824,861 | 10.05 | 10.79 |
| Cion Investment Corp. | 204 | 1,877,106 | 1,944,026 | 1,821,603 | 13.45 | 10.82 |
| Solar Capital | 136 | 1,736,535 | 1,284,449 | 1,750,247 | 10.08 | 10.09 |
| BlackRock TCP Capital Corp. | 196 | 1,656,032 | 1,728,537 | 1,631,580 | 11.41 | 11.6 |
| Oaktree Specialty Lending Corp. | 166 | 1,619,676 | 1,543,984 | 1,518,040 | 10.9 | 16.55 |
| Goldman Sachs Private Middle Market Credit Corp. | 134 | 1,501,988 | 1,699,626 | 1,482,557 | 17.41 | 13.15 |
| Goldman Sachs BDC | 148 | 1,451,655 | 1,390,560 | 1,405,097 | 17 | 12.85 |
| Pennant Park Investment | 130 | 1,427,273 | 1,151,383 | 1,274,979 | 10.42 | 10.43 |
| Goldman Sachs Middle Market Lending Corp. | 129 | 1,260,768 | 1,467,552 | 1,245,593 | 17.77 | 13.41 |
| Barings BDC | 142 | 1,216,050 | 1,220,262 | 1,189,384 | 6.92 | 6.38 |
| TCW Direct Lending LLC | 46 | 1,213,393 | 962,639 | 1,149,822 | 13.54 | 10.32 |
| Hms Income Fund Inc. | 203 | 1,126,096 | 990,529 | 1,122,774 | 12.07 | 10.4 |
| PennantPark Floating Rate Capital | 199 | 1,020,997 | 997,256 | 995,204 | 9.9 | 9.38 |
| Blackstone / GSO Secured Lending Fund | 58 | 953,706 | 953,381 | 955,832 | 8.65 | 8.68 |
| Sierra Income Corp. | 148 | 1,004,964 | 867,489 | 941,787 | 27.41 | 13.07 |
| OWL Rock Capital Corp. II | 123 | 919,223 | 933,530 | 921,261 | 8.94 | 8.98 |
| TCW Direct Lending VII LLC | 25 | 713,856 | 725,544 | 722,676 | 9.5 | 9.8 |
| TCG BDC II Inc. | 62 | 697,185 | 701,790 | 696,897 | 9.2 | 9.18 |
| BlackRock Capital Investment Corporation | 49 | 755,442 | 517,136 | 680,374 | 16.02 | 12.41 |
| Fidus Investment Corp | 137 | 622,704 | 562,562 | 670,481 | 11.9 | 11.36 |
| Gladstone Investment Corporation | 80 | 589,689 | 442,883 | 624,172 | 15.02 | 12.66 |
| Owl Rock Technology Finance Corp. | 26 | 622,137 | 625,094 | 623,711 | 8.45 | 8.45 |
| Medley Capital Corp. | 118 | 680,147 | 516,701 | 612,500 | 33.46 | 14.16 |
| Oaktree Strategic Income Corp. | 97 | 631,070 | 616,797 | 603,975 | 9.3 | 8.02 |
| Monroe Capital | 187 | 606,591 | 638,063 | 596,945 | 17.42 | 16.37 |
| Crescent Capital BDC Inc. | 182 | 524,805 | 482,862 | 520,254 | 9.73 | 8.55 |
| Stellus Capital Investment Corp. | 112 | 520,097 | 503,522 | 517,412 | 11.26 | 10.87 |
| TriplePoint Venture Growth BDC Corp. | 159 | 508,170 | 431,596 | 507,652 | 11.07 | 9.17 |
| THL Credit | 94 | 547,877 | 416,756 | 497,564 | 22.66 | 16.72 |
| Garrison Capital | 124 | 490,828 | 492,321 | 480,863 | 9.45 | 10.3 |
| WhiteHorse Finance | 60 | 475,248 | 469,745 | 468,385 | 11.53 | 11.42 |
| Solar Senior Capital | 55 | 473,252 | 373,483 | 467,673 | 12.25 | 8.09 |
| Saratoga Investment Corp. | 61 | 464,010 | 479,735 | 464,114 | 247.5 | 11.39 |
| Oxford Square Capital Corp. | 65 | 503,376 | 552,528 | 458,685 | 12.04 | 9.59 |
| Capitala Finance Corp. | 84 | 424,938 | 358,301 | 455,390 | 13.67 | 12.41 |
| OFS Capital | 87 | 454,361 | 431,329 | 437,667 | 20.13 | 11.4 |
| Venture Lending & Leasing VIII Inc. | 311 | 401,467 | 419,452 | 394,754 | 13.6 | 13.55 |
| Gladstone Capital Corp. | 104 | 406,961 | 363,158 | 387,720 | 12.37 | 11.92 |
| Guggenheim Credit Income Fund | 129 | 386,016 | 383,631 | 375,395 | 17.54 | 9.26 |
| MVC Capital | 55 | 439,002 | 212,023 | 341,623 | 13.95 | 13.88 |
| Golub Capital BDC 3 Inc. | 276 | 325,368 | 295,325 | 328,033 | 8.17 | 8.37 |
| GSV Capital Corp. | 54 | 265,188 | 106,804 | 313,551 | 269.9 | 221.86 |
| Runway Growth Credit Fund Inc. | 55 | 314,271 | 308,474 | 312,427 | 23.03 | 22.71 |
| FS Investment Corp IV | 110 | 314,225 | 315,265 | 311,687 | 10.88 | 10.02 |
| CM Finance Inc. | 43 | 305,249 | 314,766 | 299,086 | 13.96 | 13.68 |
| Audax Credit BDC Inc. | 153 | 299,996 | 300,491 | 298,035 | 7.2 | 7.06 |
| Great Elm Capital Corp. | 40 | 340,586 | 272,191 | 281,087 | 30.59 | 15.16 |
| Portman Ridge Finance Corp. | 83 | 327,193 | 157,756 | 274,513 | 76.36 | 9.39 |
| Horizon Technology Finance Corp. | 157 | 269,992 | 241,800 | 266,152 | 11.93 | 12.09 |
| Alcentra Capital Corp. | 46 | 233,130 | 203,853 | 213,749 | 10.93 | 10.69 |
| AB Private Credit Investors Corp. | 119 | 212,044 | 196,704 | 211,693 | 8.45 | 8.42 |
| Firsthand Technology Value Fund Inc. | 93 | 168,363 | 43,358 | 201,526 | 12.71 | 157.2 |
| Corporate Capital Trust II - T | 122 | 185,398 | 186,156 | 179,230 | 12.2 | 9.58 |
| Venture Lending & Leasing VII Inc. | 163 | 194,164 | 204,083 | 170,448 | 13.52 | 12.43 |
| Oaktree Strategic Income II Inc. | 65 | 168,335 | 164,028 | 169,986 | 7.42 | 7.53 |
| NexPoint Capital Inc. | 49 | 112,239 | 90,198 | 112,927 | 10.38 | 10.62 |
| Harvest Capital Credit | 41 | 106,406 | 98,446 | 101,701 | 13.31 | 13.75 |
| Mackenzie Realty Capital Inc. | 57 | 93,458 | --- | 100,373 | --- | --- |
| Venture Lending & Leasing IX Inc. | 78 | 98,317 | 106,021 | 98,305 | 14.66 | 15.9 |
| Flat Rock Capital Corp. | 34 | 87,047 | 87,793 | 86,372 | 11.82 | 11.62 |
| OHA Investment Corporation | 31 | 117,595 | 93,589 | 73,338 | 10.36 | 25.78 |
| Equus Total Return | 6 | 45,011 | 27,954 | 66,027 | --- | --- |
| Terra Income Fund 6 Inc. | 13 | 61,730 | 26,792 | 62,570 | --- | --- |
| Parkview Capital Credit Inc. | 20 | 64,569 | 51,018 | 61,792 | 86.41 | 13.42 |
| Princeton Capital Corp. | 26 | 54,793 | 38,309 | 39,932 | 20.44 | 9.41 |
| Siguler Guff Small Business Credit Opportunities Fund Inc. | 19 | --- | 33,686 | 33,263 | 11.55 | 11.46 |
| Rand Capital Corp. | 67 | 35,594 | --- | 32,491 | --- | --- |
| Hancock Park Corporate Income Inc. | 51 | 31,104 | 30,735 | 31,065 | 10.99 | 10.91 |
| Monroe Capital Income Plus Corp | 15 | 19,883 | 19,659 | 20,009 | 8.94 | 9.21 |
| SCP Private Credit Income BDC LLC | 10 | 53 | 109 | 53 | 8.65 | 8.74 |
| 12,362 | 106,755,223 | 99,555,934 | 103,930,837 | 20.9 |
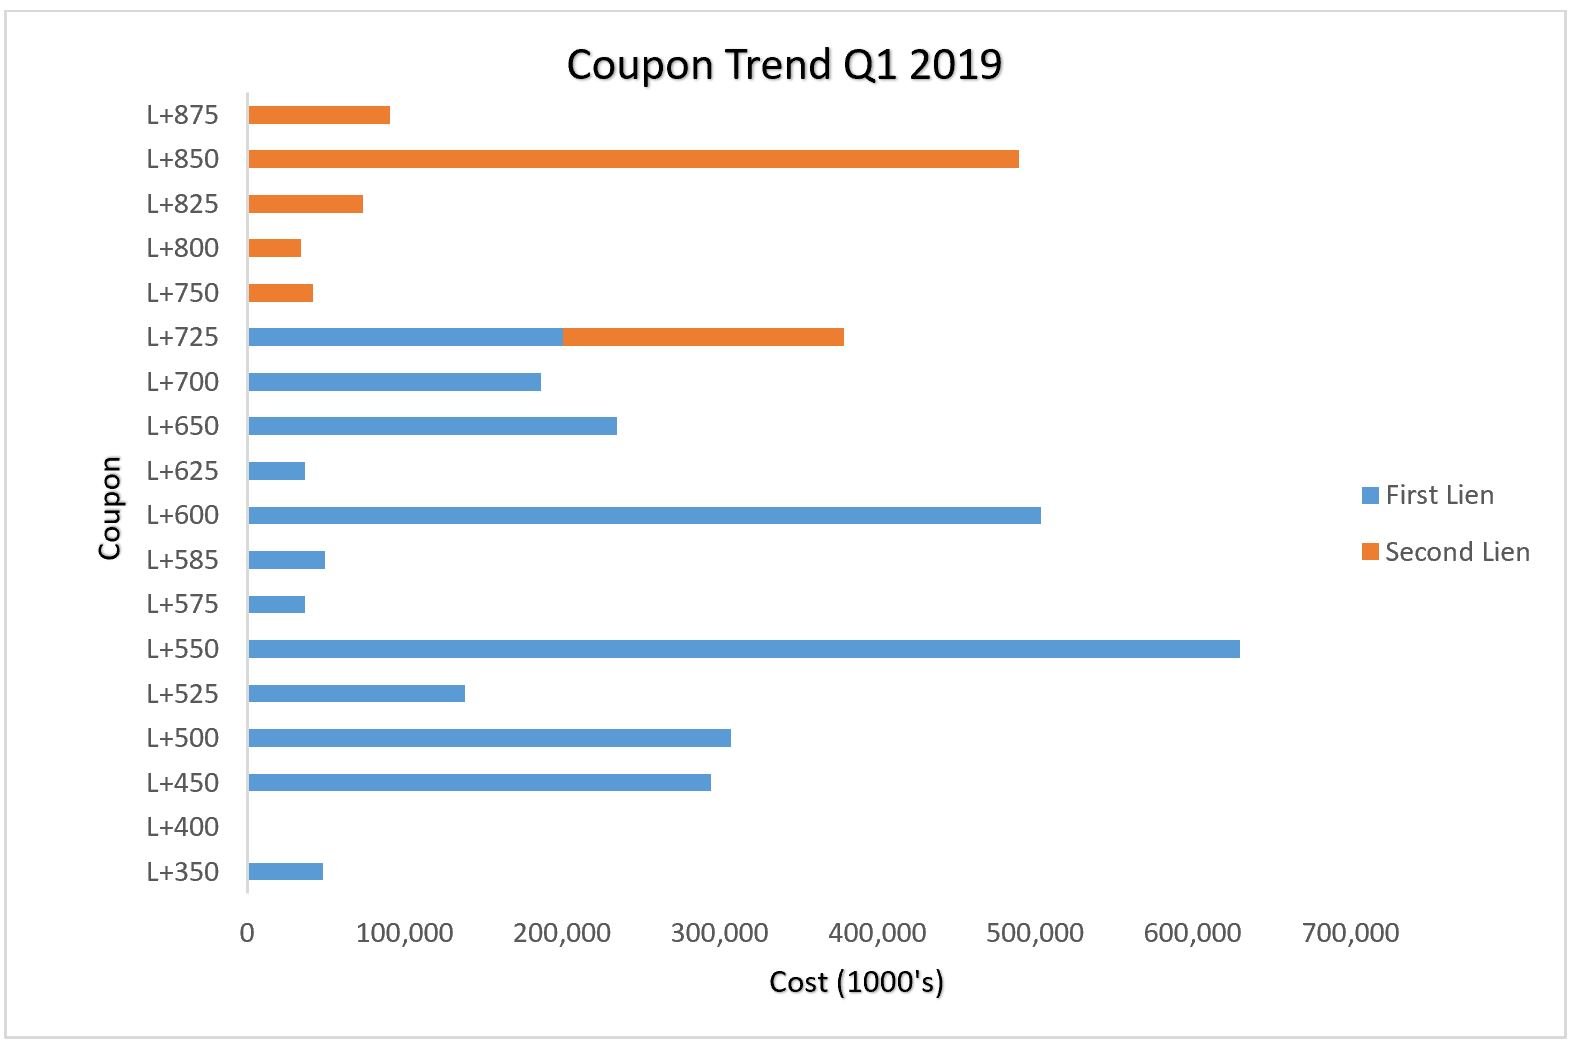
Coupon Trends of Q1 2019
As of Q1 2019, BDCs have originated around 3.6 Billion USD in New Investments. First Lien Investments were at 2.7 Billion USD representing 75% of new Investments while second lien Investments were at 907 Million USD representing 25% of new Investments. Via below chart it can be interpreted that both First Lien and Second Lien Investments were originated at L+725 which also happens to be the cut off line between First Lien and Second Lien Investments.
Non-Accruals
Out of 86 BDC’s that have filed so far, 53 BDC’s have reported at least one Non–Accrual in their portfolio. Aggregate Non-Accruals so far amounts to 2.9 Billion USD in Cost. Fair Value of Non-Accruals are reported at a significant Mark Down of 1.06 Billion USD.
Ares, Venture Lending & Leasing VII Inc., FS KKR and Business Development Corp. Of America are leading the Non-Accruals list.
The leading BDCs by percentage of Portfolio in Non-Accruals are Princeton Capital Corp. with 57.5%, Venture Lending & Leasing VII Inc. with 10.9% and OHA Investment Corp with 10.07%.
|
Name |
Number of Investments |
% Portfolio |
Cost |
Principal Value |
Fair Value |
|
Ares Capital |
27 |
0.39% |
313,700 |
448,100 |
50,800 |
|
Venture Lending & Leasing VII Inc. |
26 |
10.90% |
39,890 |
46,875 |
18,578 |
|
FS KKR Capital Corp. |
15 |
0.41% |
154,500 |
274,800 |
30,500 |
|
Business Development Corp. Of America |
14 |
1.84% |
118,976 |
177,511 |
46,541 |
|
Sierra Income Corp. |
12 |
4.28% |
95,343 |
115,817 |
40,351 |
|
Venture Lending & Leasing VIII Inc. |
12 |
3.04% |
16,994 |
18,847 |
12,014 |
|
Golub Capital Investment Corp. |
11 |
0.23% |
11,472 |
11,515 |
4,857 |
|
Medley Capital Corp. |
11 |
9.09% |
124,826 |
156,350 |
55,671 |
|
Oaktree Specialty Lending Corp. |
11 |
5.66% |
158,542 |
175,299 |
85,854 |
|
FS Investment Corp. II |
10 |
0.42% |
153,002 |
186,308 |
19,256 |
|
FS Investment Corp. III |
9 |
0.74% |
89,836 |
108,958 |
27,102 |
|
Prospect Capital |
9 |
3.40% |
487,356 |
580,927 |
193,990 |
|
THL Credit |
8 |
5.86% |
68,204 |
73,925 |
29,142 |
|
Cion Investment Corp. |
7 |
0.48% |
23,664 |
32,588 |
8,775 |
|
Gladstone Investment Corporation |
7 |
5.77% |
68,260 |
68,260 |
36,005 |
|
Main Street Capital Corp. |
7 |
0.91% |
83,435 |
87,204 |
22,621 |
|
Monroe Capital |
7 |
2.79% |
20,247 |
25,939 |
16,676 |
|
Portman Ridge Finance Corp. |
7 |
2.84% |
17,374 |
17,455 |
7,802 |
|
Golub Capital |
6 |
0.17% |
8,484 |
8,557 |
3,410 |
|
TriplePoint Venture Growth BDC Corp. |
6 |
1.71% |
10,316 |
10,176 |
8,679 |
|
Apollo Investment Corp |
5 |
2.33% |
72,003 |
113,269 |
56,852 |
|
FS Energy & Power Fund |
5 |
1.61% |
300,825 |
246,109 |
59,660 |
|
Garrison Capital |
5 |
2.83% |
16,975 |
17,448 |
13,632 |
|
Hms Income Fund Inc. |
5 |
0.36% |
6,759 |
7,157 |
3,989 |
|
New Mountain Finance |
4 |
0.00% |
1,004 |
1,073 |
13 |
|
OFS Capital |
4 |
0.17% |
12,403 |
16,139 |
732 |
|
PennantPark Floating Rate Capital |
4 |
1.47% |
31,661 |
32,052 |
14,584 |
|
Princeton Capital Corp. |
4 |
57.51% |
25,730 |
25,730 |
22,963 |
|
Saratoga Investment Corp. |
4 |
1.23% |
9,953 |
8,732 |
5,718 |
|
Stellus Capital Investment Corp. |
4 |
1.55% |
12,002 |
12,002 |
8,045 |
|
BlackRock Capital Investment Corporation |
3 |
1.19% |
39,853 |
35,639 |
8,102 |
|
Crescent Capital BDC Inc. |
3 |
1.26% |
12,539 |
13,718 |
6,551 |
|
Goldman Sachs BDC |
3 |
3.54% |
65,992 |
69,862 |
49,794 |
|
Hercules Capital Inc. |
3 |
0.52% |
23,495 |
33,523 |
10,756 |
|
Parkview Capital Credit Inc. |
3 |
5.36% |
5,790 |
5,790 |
3,312 |
|
TCG BDC Inc. |
3 |
0.81% |
58,851 |
60,156 |
17,482 |
|
Fidus Investment Corp |
2 |
0.92% |
15,359 |
15,363 |
6,191 |
|
Gladstone Capital Corp. |
2 |
0.64% |
8,549 |
8,549 |
2,484 |
|
Great Elm Capital Corp. |
2 |
1.11% |
5,540 |
7,618 |
3,117 |
|
GSV Capital Corp. |
2 |
0.50% |
4,373 |
4,373 |
1,577 |
|
Guggenheim Credit Income Fund |
2 |
0.85% |
9,784 |
10,370 |
3,181 |
|
Harvest Capital Credit |
2 |
6.74% |
6,476 |
7,611 |
6,857 |
|
OHA Investment Corporation |
2 |
10.07% |
49,367 |
27,117 |
7,383 |
|
Alcentra Capital Corp. |
1 |
--- |
3,529 |
3,529 |
--- |
|
Capitala Finance Corp. |
1 |
1.43% |
8,918 |
9,340 |
6,520 |
|
CM Finance Inc. |
1 |
3.08% |
11,142 |
11,517 |
9,214 |
|
Corporate Capital Trust II - T |
1 |
0.01% |
211 |
222 |
17 |
|
Goldman Sachs Middle Market Lending Corp. |
1 |
0.09% |
11,606 |
11,800 |
1,180 |
|
Goldman Sachs Private Middle Market Credit Corp. |
1 |
0.09% |
13,573 |
13,800 |
1,380 |
|
Oaktree Strategic Income Corp. |
1 |
--- |
796 |
1,000 |
--- |
|
Pennant Park Investment |
1 |
1.33% |
19,415 |
19,714 |
16,954 |
|
Solar Senior Capital |
1 |
0.18% |
7,028 |
7,112 |
853 |
|
WhiteHorse Finance |
1 |
0.02% |
1,024 |
1,028 |
103 |
|
|
308 |
1.33% |
2,936,944 |
3,483,873 |
1,067,821 |
Top 10 BDC Investments
BDCs portfolio quality can be measured by taking a deeper dive into BDC’s top ten investments. While these investments are small in number, these investments are primary determinants of BDC’s portfolio performance. Top 10 Investments of BDCs that have filed in Q1 2019 amount to 35.4 Billion USD accounting to 34% of their aggregate holdings.

.png)


