

BDC Filing season is in full swing. This report will analyze 8 Public BDCs that have filed this week. Aggregate Fair Value reported by these BDCs is 27.7 Billion USD which is approximately 26% of aggregate AUM of all BDCs.
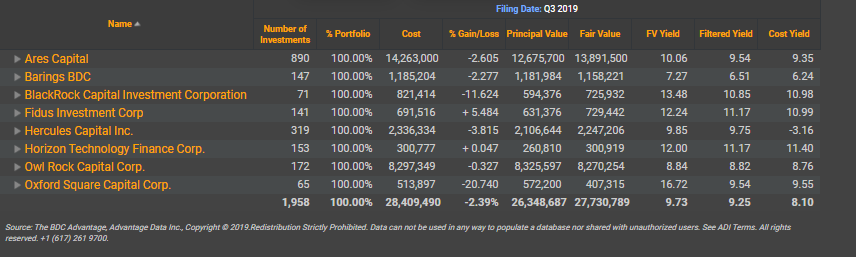
Please contact info@advantagedata.com for BDC Holdings Data.
Non-Accruals
At least 6 BDC’s so far have reported Non –Accruals amounting to 347 Million USD at Cost. Ares by far is leading the Non-Accruals list. However, compared to Q2 19, Ares has reported 7 fewer Non-Accruals.
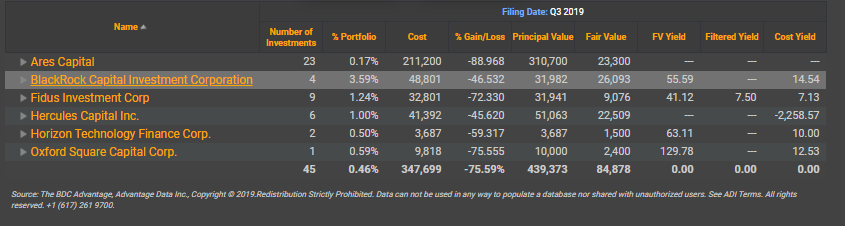
Non Accruals as Q3 2019
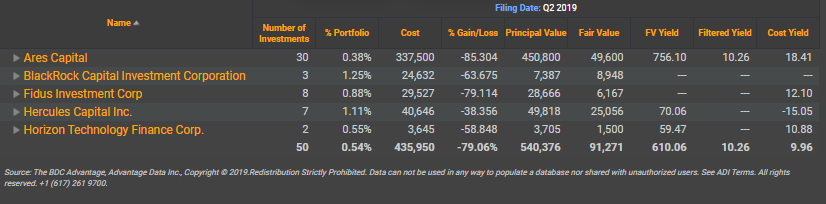
Non Accruals as Q2 2019
Please contact info@advantagedata.com for a complete list of Non-Accruals.
BDCs Investments Maturing in the next 12 Months
In the next 12 months, the aforementioned BDC’s will have Investments worth 700 Million USD at Fair Value maturation. The table below summarizes aggregate Investments of BDCs that are maturing in the next 12 months.
|
BDC |
Cost (1000) |
Fair Value (1000) |
|
Ares Capital |
536,400 |
484,200 |
|
BlackRock Capital Investment Corporation |
25,194 |
24,750 |
|
Fidus Investment Corp |
29,946 |
28,826 |
|
Hercules Capital Inc. |
116,153 |
116,020 |
|
Horizon Technology Finance Corp. |
15,098 |
14,667 |
|
Owl Rock Capital Corp. |
31,270 |
31,322 |
|
Grand Total |
754,061 |
699,785 |
Where BDC are marking their Investments?
Via the following table, it can be inferred that while 93.7% of BDCs Investments at cost are marked at 91 and up, it is important to note that 3.3 % of BDCs Investment at cost are marked at 80 or below.
|
Price Range |
Cost (1000) |
Cost |
Fair Value (1000) |
Fair Value |
|
>91 |
23,138,250.97 |
93.79% |
23,036,050.44 |
94.99% |
|
81-90 |
701,742.147 |
2.84% |
632,643.438 |
2.61% |
|
71-80 |
484,846.797 |
1.97% |
395,668.172 |
1.63% |
|
61-70 |
19,851.335 |
0.08% |
13,023.075 |
0.05% |
|
51-60 |
79,190.552 |
0.32% |
47,540.415 |
0.20% |
|
0-50 |
245,187.224 |
0.99% |
127,050.215 |
0.52% |
|
Grand Total |
24,669,069.02 |
100.00% |
24,251,975.75 |
100.00% |
Top 10 BDC Investments
BDCs portfolio quality can be measured by taking a deeper dive into BDC’s top ten investments. While these investments are small in number, these investments are primary determinants of BDC’s portfolio performance. Top 10 Investments of BDCs that have filed in this week amounts to 7.2 Billion USD (Cost) accounting to 25% of their aggregate holdings (Cost).
|
BDC |
Portfolio Company |
Cost (1000) |
Fair Value (1000) |
|
Ares Capital |
Senior Secured Loan Fund LLC |
817,400.00 |
817,400.00 |
|
Ares Capital |
Ivy Hill Asset Management |
444,000.00 |
504,600.00 |
|
Ares Capital |
Athenahealth Inc. |
363,400.00 |
366,600.00 |
|
Ares Capital |
Pathway Vet Alliance LLC |
288,600.00 |
288,600.00 |
|
Ares Capital |
Singer Sewing Company |
257,500.00 |
233,800.00 |
|
Ares Capital |
MacLean Fogg Co. |
235,000.00 |
233,900.00 |
|
Ares Capital |
Ultimate Software Group |
218,000.00 |
216,100.00 |
|
Ares Capital |
Ministry Brands Co. |
208,300.00 |
206,800.00 |
|
Ares Capital |
OTG Management LLC |
206,300.00 |
244,700.00 |
|
Ares Capital |
SymphonyIRI Group |
201,900.00 |
204,700.00 |
|
Barings BDC |
Dreyfus Mutual Funds |
27,012.47 |
27,012.47 |
|
Barings BDC |
State Street Corp. |
24,539.78 |
24,539.78 |
|
Barings BDC |
Accurus Aerospace Corp. |
24,490.33 |
24,285.54 |
|
Barings BDC |
BDP Intl. Inc. |
24,369.58 |
24,483.80 |
|
Barings BDC |
Professional DataSolutions Inc. |
23,177.27 |
22,910.20 |
|
Barings BDC |
Holley Performance Prods Inc. |
22,066.28 |
21,750.92 |
|
Barings BDC |
1WorldSync Inc. |
22,063.10 |
22,030.35 |
|
Barings BDC |
Transportation Insight LLC |
21,378.13 |
21,517.82 |
|
Barings BDC |
Campaign Monitor |
20,225.14 |
20,187.65 |
|
Barings BDC |
Heilbron |
17,378.13 |
17,106.45 |
|
BlackRock Capital Investment Corporation |
Gordon Brothers Finance Co. |
143,651.68 |
143,651.69 |
|
BlackRock Capital Investment Corporation |
BCIC Senior Loan Partners LLC |
96,333.33 |
90,866.17 |
|
BlackRock Capital Investment Corporation |
First Boston Construction Holdings LLC |
54,375.00 |
49,146.55 |
|
BlackRock Capital Investment Corporation |
AGY Holding Corp. |
48,919.32 |
41,925.43 |
|
BlackRock Capital Investment Corporation |
St George Warehousing & Trucking Co. of California Inc. |
38,688.58 |
34,239.39 |
|
BlackRock Capital Investment Corporation |
Zest Acquisition Corp. |
24,797.16 |
24,500.00 |
|
BlackRock Capital Investment Corporation |
Red Apple Stores Inc. |
23,050.00 |
17,518.00 |
|
BlackRock Capital Investment Corporation |
Sur La Table Inc. |
21,029.66 |
21,029.66 |
|
BlackRock Capital Investment Corporation |
Paragon Films Inc. |
20,610.54 |
20,790.00 |
|
BlackRock Capital Investment Corporation |
Vertellus Specialties Inc. |
17,461.30 |
17,461.30 |
|
Fidus Investment Corp |
Accent Food Services LLC |
36,126.00 |
35,032.00 |
|
Fidus Investment Corp |
BCM One Group Hldg Inc. |
28,214.00 |
28,493.00 |
|
Fidus Investment Corp |
Hub Acquisition Sub LLC |
25,203.00 |
26,424.00 |
|
Fidus Investment Corp |
Pugh Lubricants LLC |
24,096.00 |
24,733.00 |
|
Fidus Investment Corp |
AVC Investors LLC |
22,912.00 |
23,245.00 |
|
Fidus Investment Corp |
Worldwide Express Operations LLC |
22,683.00 |
24,231.00 |
|
Fidus Investment Corp |
Allied 100 Group Inc. |
22,647.00 |
22,846.00 |
|
Fidus Investment Corp |
Wheel Pros LLC |
21,311.00 |
21,311.00 |
|
Fidus Investment Corp |
Pfanstiehl Inc. |
7,050.00 |
25,154.00 |
|
Fidus Investment Corp |
Pinnergy LTD |
6,000.00 |
36,771.00 |
|
Hercules Capital Inc. |
Bridgebio Pharma LLC |
77,674.00 |
80,276.00 |
|
Hercules Capital Inc. |
Paratek Pharmaceuticals Inc. |
74,865.00 |
72,176.00 |
|
Hercules Capital Inc. |
EverFi Inc. |
71,470.00 |
71,787.00 |
|
Hercules Capital Inc. |
Oak Street Health |
60,969.00 |
60,683.00 |
|
Hercules Capital Inc. |
Businessolver.Com Inc. |
57,002.00 |
57,233.00 |
|
Hercules Capital Inc. |
Khoros LLC |
54,722.00 |
54,705.00 |
|
Hercules Capital Inc. |
Impossible Foods Inc. |
53,238.00 |
52,880.00 |
|
Hercules Capital Inc. |
Mesoblast LTD |
51,193.00 |
51,286.00 |
|
Hercules Capital Inc. |
Snagajobcom Inc. |
48,871.00 |
48,120.00 |
|
Hercules Capital Inc. |
Gibraltar Business Capital LLC |
42,772.00 |
48,955.00 |
|
Horizon Technology Finance Corp. |
CVRx Inc. |
19,800.00 |
19,800.00 |
|
Horizon Technology Finance Corp. |
US Bank Money Market Deposit Account |
19,400.00 |
19,400.00 |
|
Horizon Technology Finance Corp. |
Bridge2 Solutions Inc. |
15,411.00 |
15,730.00 |
|
Horizon Technology Finance Corp. |
HealthEdge Software Inc. |
15,036.00 |
15,019.00 |
|
Horizon Technology Finance Corp. |
GroundTruth (xAd Inc.) |
15,006.00 |
15,068.00 |
|
Horizon Technology Finance Corp. |
Mohawk Group Inc. |
14,916.00 |
14,729.00 |
|
Horizon Technology Finance Corp. |
Horizon Secured Loan Fund I LLC |
14,358.00 |
14,323.00 |
|
Horizon Technology Finance Corp. |
IgnitionOne Inc |
12,051.00 |
11,457.00 |
|
Horizon Technology Finance Corp. |
CSA Medical Inc. |
11,884.00 |
11,875.00 |
|
Horizon Technology Finance Corp. |
MacuLogix Inc. |
11,613.00 |
11,518.00 |
|
Owl Rock Capital Corp. |
Gerson Lehrman Group Inc. |
312,514.00 |
310,438.00 |
|
Owl Rock Capital Corp. |
Associations Inc. |
287,962.00 |
287,981.00 |
|
Owl Rock Capital Corp. |
Nelipak Holding Co. |
229,774.00 |
226,712.00 |
|
Owl Rock Capital Corp. |
IQNavigator |
196,814.00 |
196,298.00 |
|
Owl Rock Capital Corp. |
Definitive Healthcare Hldgs LLC |
193,802.00 |
193,742.00 |
|
Owl Rock Capital Corp. |
Endries Acquisition Holdings |
185,725.00 |
184,588.00 |
|
Owl Rock Capital Corp. |
Pregis Topco Corp. |
182,658.00 |
182,607.00 |
|
Owl Rock Capital Corp. |
Troon Golf LLC |
176,147.00 |
178,172.00 |
|
Owl Rock Capital Corp. |
GC Agile Hldg Limited |
157,951.00 |
157,465.00 |
|
Owl Rock Capital Corp. |
Swipe Acquisition Corp. |
156,904.00 |
155,631.00 |
|
Oxford Square Capital Corp. |
Sound Point CLO XVI Ltd |
42,989.44 |
24,570.00 |
|
Oxford Square Capital Corp. |
Quest Software US Holdings Inc |
20,794.39 |
20,558.06 |
|
Oxford Square Capital Corp. |
Keystone Acquisition Corp |
20,315.71 |
19,918.71 |
|
Oxford Square Capital Corp. |
OMNIA Partners Inc. |
19,866.28 |
19,521.18 |
|
Oxford Square Capital Corp. |
ECI Software |
19,850.79 |
19,298.47 |
|
Oxford Square Capital Corp. |
Nassau 2019-I Ltd |
19,810.07 |
17,390.00 |
|
Oxford Square Capital Corp. |
Shift4 Payments LLC |
19,772.15 |
19,549.13 |
|
Oxford Square Capital Corp. |
Help/Systems LLC |
19,441.24 |
19,415.81 |
|
Oxford Square Capital Corp. |
Access CIG LLC |
17,341.58 |
17,155.66 |
|
Oxford Square Capital Corp. |
Global Tel Link Corp. |
16,717.54 |
16,054.46 |
.png)


