
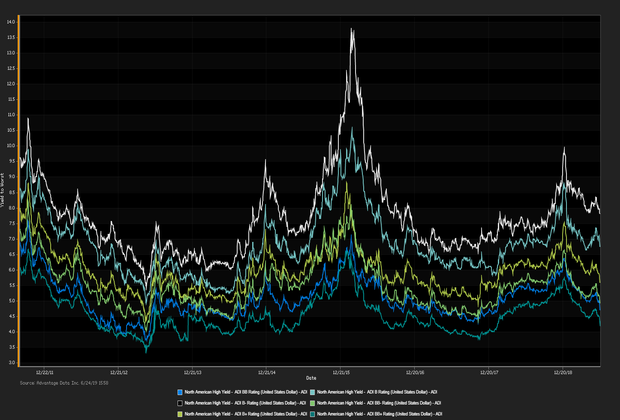
MORTGAGE APPLICATIONS SLIPPED for the third consecutive week as borrowing costs ticked higher, application volume shrunk by 1.1 percent. Refinancing activity increased week over week and was 87 percent higher than one year ago. Homebuilding often reports tandem results with applications decreased for the second month as permits fell to a two year low. “Residential housing construction is one of the leading indicators of a recession, and while construction activity isn’t dropping precipitously, housing is stuck in a rut.” ADI proprietary index data showed a net yield increment for high-yield versus high-grade bonds. High-grade edged out high-yield. Among high-grade bonds showing topmost price gains at appreciable volumes traded, PPL Electric Utilities Corp. (USD) 5.2% 7/15/2041 made analysts' 'Conviction Buy' lists. (See the chart for ADI index above.) Corey Mahoney (cmahoney@advantagedata.com).
| Key Gainers and Losers | Volume Leaders | |||||||||
|---|---|---|---|---|---|---|---|---|---|---|
|
Antero Resources Corp. 5.625% 6/1/2023 CNH Industrial NV 4.875% 4/1/2021 |
| Industry Returns Tracker | ||||||||||||||||||||||||||||||||||||||||||||||||||||||||||||||||||||||||||||||||||||||||||||||||||
|---|---|---|---|---|---|---|---|---|---|---|---|---|---|---|---|---|---|---|---|---|---|---|---|---|---|---|---|---|---|---|---|---|---|---|---|---|---|---|---|---|---|---|---|---|---|---|---|---|---|---|---|---|---|---|---|---|---|---|---|---|---|---|---|---|---|---|---|---|---|---|---|---|---|---|---|---|---|---|---|---|---|---|---|---|---|---|---|---|---|---|---|---|---|---|---|---|---|---|
|
||||||||||||||||||||||||||||||||||||||||||||||||||||||||||||||||||||||||||||||||||||||||||||||||||
| New Issues | Forward Calendar |
|---|---|
|
(None Current 07/17/2019)
|
1. Sinclair Broadcast Group Inc.: $2.55B, seven-year senior secured notes; $2.325B eight year senior unsecured notes |
Additional Commentary
| Top Widening Credit Default Swaps (CDS) | Top Narrowing Credit Default Swaps (CDS) |
| Hertz Corp. (5Y Sen USD XR14) Hovnanian Enterprises Inc. (5Y Sen USD XR14) |
Cable & Wireless Communication (5Y Sen USD CR14) SuperValu Inc. (5Y Sen USD MR14) |
Loans and Credit Market Overview
Deals recently freed for secondary trading, notable secondary activity:
- Consolidated Precision Products, Starwood Property Trust Inc., Heritage Power, LLC
- TED spread held below 16 bp (basis points), as of 07/17/19
- Net positive capital flows into high-yield ETFs & mutual funds
Copyright 2019 Advantage Data Inc. All Rights Reserved. http://www.advantagedata.com
Information in this document should not be regarded as an offer to sell or solicitation of an offer to buy bonds or any financial instruments referred to herein. All information provided in this document is believed to be accurate. However, Advantage Data and its sources make no warranties, either express or implied, as to any matter whatsoever, including but not limited to warranties of merchantability or fitness for a particular purpose. Opinions in this document are subject to change without notice. Electronic redistribution, photocopying and any other electronic or mechanical reproduction is strictly prohibited without prior written permission from Advantage Data Inc.
.png)


