RISK TAKING WAS SCALED BACK AS INVESTMENT-GRADE DEBT ROSE against its high-yield counterpart in net prices linked to actual trades. The Federal Reserve held interest rates at their current levels following the meeting on Wednesday. Jerome Powell stated softening inflation is likely to be “transient,” but if easing inflation persists it is “something we would be concerned about.” The 10-year note gained 0.7 basis points. S&P -0.57%, DOW -0.44%, NASDAQ -0.32%.
ACCORDING TO ADP THE PRIVATE SECTOR payrolls spiked
adding 275,000 jobs in April surpassing estimates of 180,000 jobs. Mark Zandi chief an economist at Moody noted,
“This number overstates the case,” the market should not jump to conclusions based off this report. Factory activity unexpectedly dipped to a two-and-half year low in April; the ISM fell to 52.8 compared to 55.3 in March.
“The slowing manufacturing sector needs to be watched carefully as income gains are not strong enough to support solid growth,” ADI proprietary index data showed a net
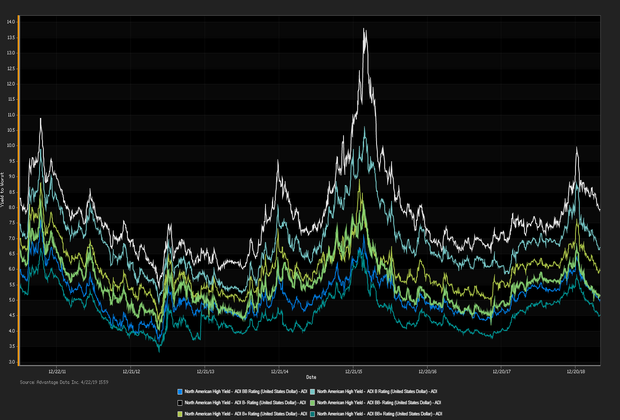
yield increment for high-yield versus high-grade bonds. High-grade edged out high-yield. Among high-grade bonds showing topmost price gains at appreciable volumes traded,
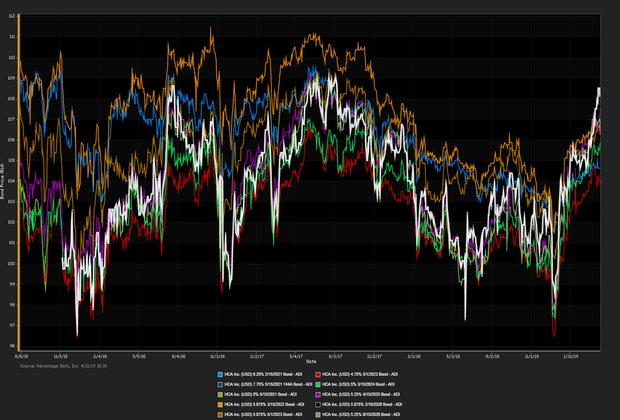
Newell Rubbermaid Inc. (USD) 5.5% 4/1/2046 made analysts' 'Conviction Buy' lists. (See the chart for
ADI Indexes above.)
Corey Mahoney cmahoney@advantagedata.com).
| Key Gainers and Losers |
Volume Leaders |
| + |
Charter Communications Operating LLC 5.75% 4/1/2048 |
+ 0.4% |
| |
Flagstar Corp. 6.125% 7/15/2021 (1) |
+ 0.2% |
| - |
ArcelorMittal SA 6.125% 6/1/2025 |
-0.5% |
|
ArcelorMittal SA 6.125% 6/1/2025
Petrobras Global Finance BV 6.85% 6/5/2115
|
| Industry Returns Tracker |
| Industry |
Past Day |
Past Week |
Past Month |
Past Quarter |
YTD |
Past Year |
| Agriculture, Forestry, Fishing |
0.22% |
0.08% |
0.66% |
5.60% |
8.67% |
9.14% |
| Mining |
-0.00% |
-0.30% |
1.60% |
4.17% |
9.61% |
4.63% |
| Construction |
-0.03% |
0.03% |
1.49% |
5.17% |
8.25% |
5.93% |
| Manufacturing |
0.07% |
0.26% |
1.29% |
4.63% |
7.84% |
6.93% |
| Transportion, Communication, Electric/Gas |
0.09% |
0.30% |
1.44% |
5.33% |
7.86% |
6.81% |
| Wholesale |
0.05% |
0.25% |
1.15% |
4.15% |
8.00% |
5.10% |
| Retail |
0.17% |
0.94% |
2.52% |
6.08% |
10.39% |
8.17% |
| Finance, Insurance, Real-Estate |
0.14% |
0.31% |
1.27% |
4.48% |
7.97% |
6.85% |
| Services |
0.06% |
0.20% |
1.11% |
4.21% |
8.04% |
7.41% |
| Public Administration |
0.02% |
-0.08% |
0.43% |
3.20% |
6.19% |
10.50% |
| Energy |
0.03% |
-0.16% |
1.68% |
4.51% |
9.47% |
4.34% |
| |
| Total returns (non-annualized) by rating, market weighted. |
|
| New Issues |
Forward Calendar |
|
(None Current 05/01/2019)
|
1. Calpine Corp.: $1.4B bonds, Expected Q2 2019
2. Starwood Property Trust Inc: $300M senior notes, Expected Q2 2019
|
Additional Commentary
NEW ISSUANCE WATCH: on 4/29/19 participants welcome a $500MM new corporate-bond offering by
Moss Creek Resources LLC. The most recent data showed money flowed out of high-yield ETFs/mutual funds for the week ended 4/26/19, with a net outflow of $0.520B, year-to-date $13.8B flowed into high-yield.
| Top Widening Credit Default Swaps (CDS) |
Top Narrowing Credit Default Swaps (CDS) |
Hertz Corp. (5Y Sen USD XR14)
Hovnanian Enterprises Inc. (5Y Sen USD MR14) |
Cable & Wireless Communication (5Y Sen USD CR14)
SuperValu Inc. (5Y Sen USD MR14) |
Loans and Credit Market Overview
SYNDICATED LOANS HIGHLIGHTS:
Deals recently freed for secondary trading, notable secondary activity:
- iHeartCommunications Inc., Flexera Software Inc., JBS USA LLC, Sundyne US Purchaser
OVERALL CREDIT MARKET:
Long-term bond yields are expected to hit a cyclical peak in 2019 given tight fiscal policy and lagging global economies. Europe remains checked by stubbornly low inflationary forces. Positive effects remained in force:
- TED spread held below 16 bp (basis points), as of 05/01/19
- Net positive capital flows into high-yield ETFs & mutual funds
Copyright 2019 Advantage Data Inc. All Rights Reserved. http://www.advantagedata.com
Information in this document should not be regarded as an offer to sell or solicitation of an offer to buy bonds or any financial instruments referred to herein. All information provided in this document is believed to be accurate. However, Advantage Data and its sources make no warranties, either express or implied, as to any matter whatsoever, including but not limited to warranties of merchantability or fitness for a particular purpose. Opinions in this document are subject to change without notice. Electronic redistribution, photocopying and any other electronic or mechanical reproduction is strictly prohibited without prior written permission from Advantage Data Inc.

.png?width=620&name=unnamed%20(92).png)
.png)


