
Click Here for a Free Trial to Advantage Data Charting
.png?width=620&name=unnamed%20(92).png)
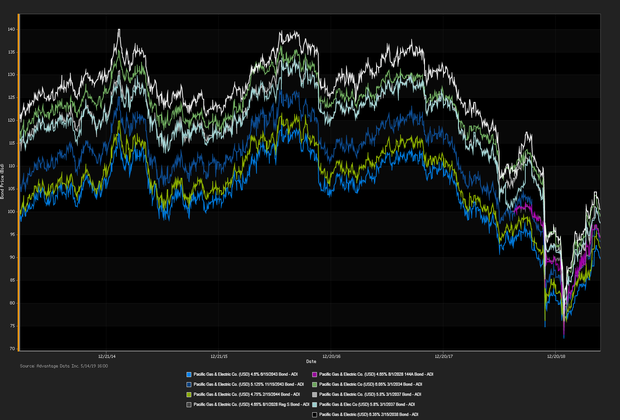
MORTGAGE DEFAULTS CLIMBED IN THE FIRST QUARTER OF 2019 rising from 18-year low, meanwhile, mortgage originations fell during the same period. The White House announced plans to privatize Franny Mac and Freddie Mac in the even Congress does not come up with a plan to overhaul the two giant mortgage middlemen. Delivery of June Crude oil advanced subsequent to reports of attacks on a Saudi Arabia oil facility, “the attack on pumping stations of the East-West pipeline in Saudi Arabia is significant”.. ADI proprietary index data showed a net yield increment for high-yield versus high-grade bonds. High-yield edged out high-grade. Among high-yield bonds showing topmost price gains at appreciable volumes traded, Pacific Gas & Electric Co. (USD) 3.5% 10/1/2020 made analysts' 'Conviction Buy' lists. (See the chart for Pacific Gas & Electric Co. below.) Corey Mahoney (cmahoney@
| Key Gainers and Losers | Volume Leaders | |||||||||
|---|---|---|---|---|---|---|---|---|---|---|
|
Petrobras Global Finance BV 7.375% 1/17/2027 Valeant Pharmaceuticals Intl. Inc. 5.5% 11/1/2025 144A |
| Industry Returns Tracker | ||||||||||||||||||||||||||||||||||||||||||||||||||||||||||||||||||||||||||||||||||||||||||||||||||
|---|---|---|---|---|---|---|---|---|---|---|---|---|---|---|---|---|---|---|---|---|---|---|---|---|---|---|---|---|---|---|---|---|---|---|---|---|---|---|---|---|---|---|---|---|---|---|---|---|---|---|---|---|---|---|---|---|---|---|---|---|---|---|---|---|---|---|---|---|---|---|---|---|---|---|---|---|---|---|---|---|---|---|---|---|---|---|---|---|---|---|---|---|---|---|---|---|---|---|
|
||||||||||||||||||||||||||||||||||||||||||||||||||||||||||||||||||||||||||||||||||||||||||||||||||
| New Issues | Forward Calendar |
|---|---|
|
(None Current 05/14/2019)
|
1. Twinset Spa: ¬170M 5 year senior secured floating-rate notes, Expected Q2 2019 |
Additional Commentary
| Top Widening Credit Default Swaps (CDS) | Top Narrowing Credit Default Swaps (CDS) |
| Hertz Corp. (5Y Sen USD XR14) Hovnanian Enterprises Inc. (5Y Sen USD MR14) |
SuperValu Inc. (5Y Sen USD XR14) San Miguel Corp. (5Y Sen USD CR14) |
Loans and Credit Market Overview
SYNDICATED LOANS HIGHLIGHTS:Deals recently freed for secondary trading, notable secondary activity:
- Eldorado Gold Corp., Oryx Midstream, Hargray Communications Group Inc., Rikshem AB
Long-term bond yields are expected to hit a cyclical peak in 2019 given tight fiscal policy and lagging global economies. Europe remains checked by stubbornly low inflationary forces. Positive effects remained in force:
- TED spread held below 12 bp (basis points), as of 05/14/19
- Net positive capital flows into high-yield ETFs & mutual funds
Copyright 2019 Advantage Data Inc. All Rights Reserved. http://www.advantagedata.com
Information in this document should not be regarded as an offer to sell or solicitation of an offer to buy bonds or any financial instruments referred to herein. All information provided in this document is believed to be accurate. However, Advantage Data and its sources make no warranties, either express or implied, as to any matter whatsoever, including but not limited to warranties of merchantability or fitness for a particular purpose. Opinions in this document are subject to change without notice. Electronic redistribution, photocopying and any other electronic or mechanical reproduction is strictly prohibited without prior written permission from Advantage Data Inc.
.png)


