U.S. STOCKS FELL FOR THE second consecutive day on Tuesday as trade tensions with China persist. The White House’s earlier threats to increase tariffs on Chinese imports appear to have escalated into an impending reality. Reactions today resulted in nearly a 500 point drop in the Dow Jones, which fell to 25,965. 10-Year U.S. Treasury Notes fell 3.3 basis points amid today's news. S&P -1.65%, Dow -1.79%, NASDAQ -1.96%.
ANALYSTS PREDICT VOLATILITY in the markets to continue for weeks to come. According to Corrie Driebusch of the Wall Street Journal, "
Semiconductor companies in particular stand to lose a lot from a disappointing trade agreement, as China is a strong driver for the chip-equipment sector".
Intel shares fell 2.2% Tuesday as a result of trade tensions, slightly more so than market averages.
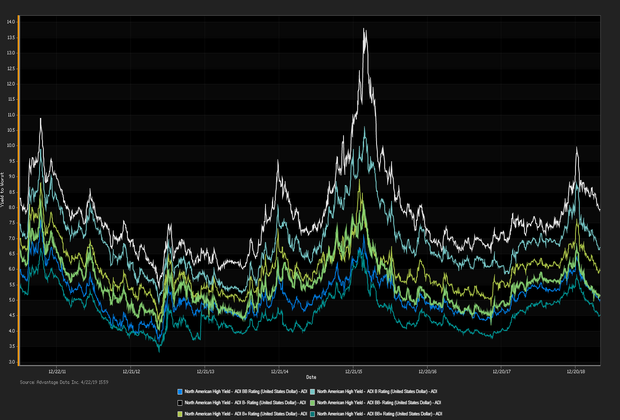
Crude Oil was down 1.59% as US-China trade tensions pose a possible decrease in global energy demands. ADI proprietary index data showed a net
yield increment for high-yield versus high-grade bonds. High-grade edged out high-yield. Among high-grade bonds showing topmost price gains at appreciable volumes traded,
Mattel Inc. (USD) 6.2% 10/1/2040 made analysts' 'Conviction Buy' lists. (See the chart for
ADI Inedexes above.)
Andrew Robartes (
arobartes@advantagedata.com).
| Key Gainers and Losers |
Volume Leaders |
| + |
Dean Foods Co. 6.5% 3/15/2023 144A |
+ 11.3% |
| |
Hertz Corp. 5.5% 10/15/2024 144A |
+ 1.8% |
| - |
CenturyLink Inc. 7.5% 4/1/2024 |
-0.1% |
|
Whiting Petroleum Corp. 6.625% 1/15/2026
Park Aerospace Hldgs LTD 5.5% 2/15/2024 144A
|
| Industry Returns Tracker |
| Industry |
Past Day |
Past Week |
Past Month |
Past Quarter |
YTD |
Past Year |
| Agriculture, Forestry, Fishing |
-0.10% |
0.33% |
0.35% |
2.69% |
6.38% |
7.09% |
| Mining |
-0.18% |
-0.80% |
0.29% |
2.27% |
9.01% |
4.11% |
| Construction |
-0.21% |
-0.25% |
0.98% |
4.18% |
8.31% |
5.66% |
| Manufacturing |
-0.15% |
-0.17% |
0.76% |
3.34% |
7.79% |
6.80% |
| Transportion, Communication, Electric/Gas |
-0.09% |
0.09% |
1.08% |
4.27% |
8.02% |
7.37% |
| Wholesale |
-0.13% |
-0.14% |
0.87% |
3.27% |
7.98% |
5.35% |
| Retail |
-0.11% |
0.18% |
1.82% |
4.77% |
10.10% |
8.00% |
| Finance, Insurance, Real-Estate |
-0.09% |
0.04% |
0.84% |
3.26% |
7.85% |
6.82% |
| Services |
-0.14% |
-0.05% |
0.61% |
3.07% |
8.14% |
7.55% |
| Public Administration |
-0.19% |
0.43% |
0.84% |
3.30% |
6.63% |
12.26% |
| Energy |
-0.14% |
-0.78% |
0.62% |
2.42% |
8.99% |
3.65% |
| |
| Total returns (non-annualized) by rating, market weighted. |
|
| New Issues |
Forward Calendar |
|
1. NRG Energy Inc. (USD) 5.25% 6/15/2029 144A (05/07/2019):733MM Senior Unsecured Notes, Price at Issuance 100, Yielding 5.25%.
|
1. Calpine Corp.: $1.4B bonds, Expected Q2 2019
2. Starwood Property Trust Inc: $300M senior notes, Expected Q2 2019
|
Additional Commentary
NEW ISSUANCE WATCH: on 5/07/19 participants welcome a $733MM new corporate-bond offering by
NRG Energy Inc. The most recent data showed money flowed into high-yield ETFs/mutual funds for the week ended 5/03/19, with a net inflow of $21.3MM, year-to-date $13.9B flowed into high-yield.
| Top Widening Credit Default Swaps (CDS) |
Top Narrowing Credit Default Swaps (CDS) |
Rite Aid Corp. (5Y Sen USD MR14)
Weatherford International LTD (5Y Sen USD MR14) |
SuperValu Inc. (5Y Sen USD MR14)
Atmos Energy Corp. (5Y Sen USD MR14) |
Loans and Credit Market Overview
SYNDICATED LOANS HIGHLIGHTS:
Deals recently freed for secondary trading, notable secondary activity:
- Verifone Inc., Twin River Management Group Inc., Lonsdale Finance Pty LTD
OVERALL CREDIT MARKET:
Long-term bond yields are expected to hit a cyclical peak in 2019 given tight fiscal policy and lagging global economies. Europe remains checked by stubbornly low inflationary forces. Positive effects remained in force:
- TED spread held below 14 bp (basis points), as of 05/07/19
- Net positive capital flows into high-yield ETFs & mutual funds
Copyright 2019 Advantage Data Inc. All Rights Reserved. http://www.advantagedata.com
Information in this document should not be regarded as an offer to sell or solicitation of an offer to buy bonds or any financial instruments referred to herein. All information provided in this document is believed to be accurate. However, Advantage Data and its sources make no warranties, either express or implied, as to any matter whatsoever, including but not limited to warranties of merchantability or fitness for a particular purpose. Opinions in this document are subject to change without notice. Electronic redistribution, photocopying and any other electronic or mechanical reproduction is strictly prohibited without prior written permission from Advantage Data Inc.

.png?width=620&name=unnamed%20(83).png)
.png)


