PRODUCER PRICES ROSE IN AUGUST edging 0.1 percent higher supporting the market's expectation the Federal Reserve will cut interest rates next week. Gold closed above $1,500 for the first time since early August as the White House sparked fear, “Federal Reserve should get our interest rates down to ZERO, or less”. The 10-year note rose 0.1 basis points. S&P +0.72%, DOW +0.84, NASDAQ +1.06%.
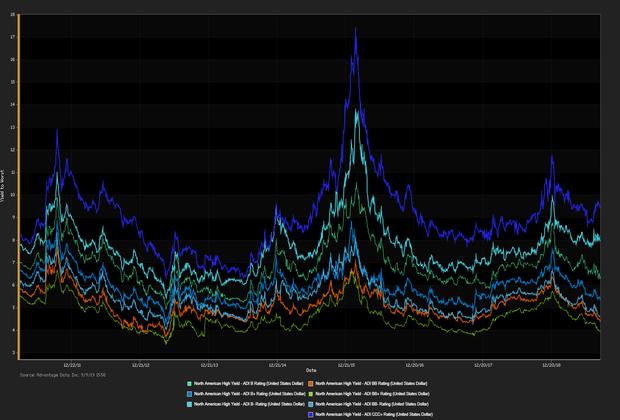
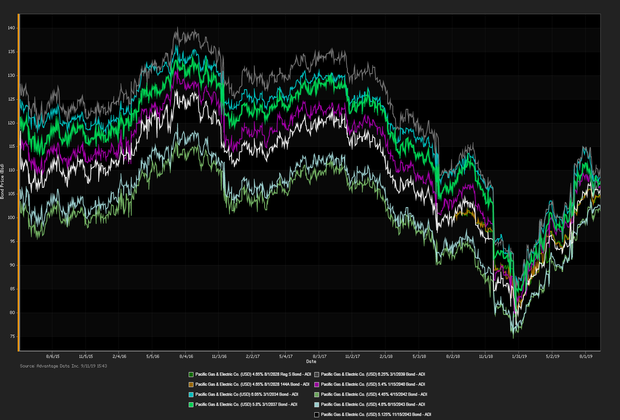
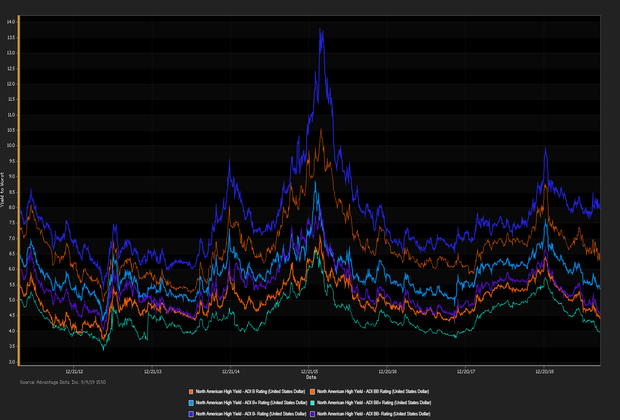
INVESTORS PULLED $4.4 BILLION from mutual and exchange-traded funds that hold U.S. stocks during the week ended September 6. Last week marked the fourth out of five weeks of outflows amid concerns over a trade war. In addition, many investment banks are predicting the U.S. will enter a recession within the next 12 months. Year to date investors have pulled a staggering $98 billion from U.S. stock funds a clear indication of shifting strategies mitigating risk. ADI proprietary index data showed a net yield increment for high-grade versus high-yield bonds. High-yield edged out high-grade. Among high-yield bonds showing topmost price gains at appreciable volumes traded, Pacific Gas & Electric Co. (USD) 3.3% 12/1/2027 made analysts' 'Conviction Buy' list (See the chart below for Pacific Gas & Electric Co bonds below) Corey Mahoney
| Key Gainers and Losers |
Volume Leaders |
| + |
Teva Pharmaceutical Industries LTD 2.8% 7/21/2023 |
+ 2.0% |
| |
Frontier Communications Corp. 10.5% 9/15/2022 |
+ 0.9% |
| - |
TransDigm Inc. 6.375% 6/15/2026 |
-0.3% |
|
Whiting Petroleum Corp. 6.625% 1/15/2026
Pacific Gas & Electric Co. 6.05% 3/1/2034 |
| Industry Returns Tracker |
| Industry |
Past Day |
Past Week |
Past Month |
Past Quarter |
YTD |
Past Year |
| Agriculture, Forestry, Fishing |
-0.33% |
0.47% |
1.54% |
6.48% |
14.02% |
16.25% |
| Mining |
0.44% |
1.14% |
1.73% |
-1.31% |
6.25% |
1.05% |
| Construction |
-0.03% |
0.20% |
1.55% |
4.17% |
13.31% |
10.16% |
| Manufacturing |
-0.05% |
0.14% |
1.17% |
2.48% |
10.62% |
7.71% |
| Transportion, Communication, Electric/Gas |
-0.10% |
0.27% |
1.05% |
3.58% |
12.95% |
9.91% |
| Wholesale |
0.02% |
0.19% |
0.92% |
2.60% |
11.76% |
7.89% |
| Retail |
-0.03% |
0.48% |
1.20% |
2.53% |
13.89% |
10.46% |
| Finance, Insurance, Real-Estate |
-0.08% |
0.26% |
1.24% |
3.73% |
12.49% |
10.50% |
| Services |
-0.06% |
0.33% |
1.46% |
3.16% |
11.60% |
9.03% |
| Public Administration |
0.02% |
-0.07% |
1.03% |
4.51% |
12.81% |
16.76% |
| Energy |
0.34% |
0.98% |
1.94% |
-0.57% |
7.37% |
1.87% |
| |
| Total returns (non-annualized) by rating, market weighted. |
|
| New Issues |
Forward Calendar |
|
1. Brookfield Residential Properties Inc. (USD) 6.25% 9/15/2027 144A (09/10/2019): 600MM Senior Unsecured Notes, Price at Issuance 100, Yielding 6.25%.
2. Sensata Technologies BV (USD) 4.375% 2/15/2030 144A (09/10/2019): 450MM Senior Unsecured Notes, Price at Issuance 100, Yielding 4.38%.
|
1. Twinset Spa: ¬170M 5 year senior secured floating-rate notes, Expected Q3 2019
2. Calpine Corp.: $1.4B bonds, Expected Q3 2019
|
Additional Commentary
NEW ISSUANCE WATCH: on 09/10/19 participants welcome a $525M new corporate-bond offering by
Triumph Group Inc .
The most recent data showed a significant flow into fixed income ETFs for the month of August, with a net inflow of $14.0 billion.
| Top Widening Credit Default Swaps (CDS) |
Top Narrowing Credit Default Swaps (CDS) |
Weatherford International LTD (5Y Sen USD XR14)
Hertz Corp. (5Y Sen USD CR14) |
Cable & Wireless Communication (5Y Sen USD CR14)
SuperValu Inc. (5Y Sen USD MR14) |
Loans and Credit Market Overview
SYNDICATED LOANS HIGHLIGHTS:
Deals recently freed for secondary trading, notable secondary activity:
- Beazer Homes USA Inc., Murphy Oil USA Inc., Electronic Arts Inc., AutoData
Long-term bond yields are expected to hit a cyclical peak in 2019 given tight fiscal policy and lagging global economies. Europe remains checked by stubbornly low inflationary forces. Positive effects remained in force:
- TED spread held below 20 bp (basis points), as of 09/11/19
- Net positive capital flows into high-yield ETFs & mutual funds
Copyright 2019 Advantage Data Inc. All Rights Reserved. http://www.advantagedata.com
Information in this document should not be regarded as an offer to sell or solicitation of an offer to buy bonds or any financial instruments referred to herein. All information provided in this document is believed to be accurate. However, Advantage Data and its sources make no warranties, either express or implied, as to any matter whatsoever, including but not limited to warranties of merchantability or fitness for a particular purpose. Opinions in this document are subject to change without notice. Electronic redistribution, photocopying and any other electronic or mechanical reproduction is strictly prohibited without prior written permission from Advantage Data Inc.

.png)


