MANUFACTURING IN MAY EXPANDED AT ITS SLOWEST RATE in over two years slipping to 52.1 from 52.8 from April. The sentiment downturn is linked to recent trade threats made by the White House and indications pointing to a slowing global economy. The sector is also being hindered by responses from countries following increased tariffs from the US. The 10-year note further fell 5.6 basis points. S&P-0.61%, DOW -0.30%, NASDAQ -1.97%.
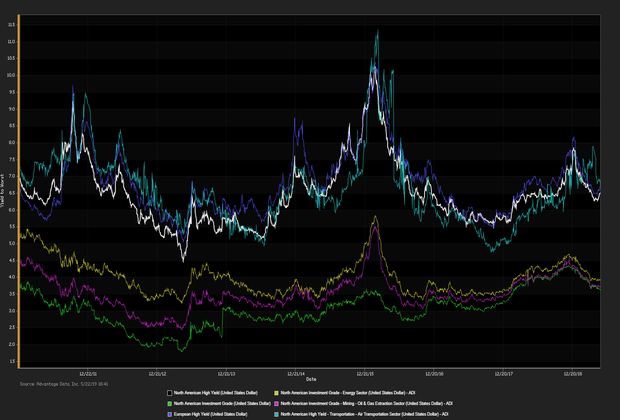
THE BOND MARKET RALLY CONTINUES into June as investors flee to safe-haven assets
amidst global uncertainty and volatile equity markets.
G component Google parent Alphabet of the
FAANG group
sank 6.72 percent following the Department of Justice launching an
antitrust investigation blocking competition dragging the
Nasdaq Composite near correction territory. Investors fear tech companies face scrutiny and this is
the tip of the iceberg,
"secured the rights to begin a potential investigation of Facebook Inc. [S: FB] and whether it has engaged in unlawful monopolistic practices". ADI proprietary index data showed a net
yield increment for high-yield versus high-grade bonds.
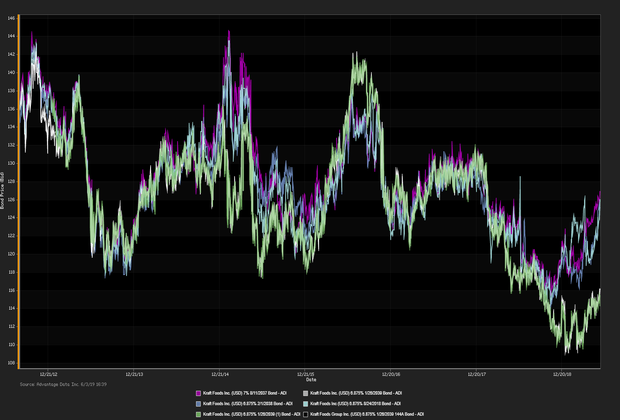
High-grade edged out high-yield. Among high-grade bonds showing topmost price gains at appreciable volumes traded,
Kraft Foods Inc. (USD) 5% 6/4/2042 made analysts' 'Conviction Buy' lists. (See the chart for
Kraft Foods Inc. bonds below.)
Corey Mahoney (
cmahoney@advantagedata.com).
| Key Gainers and Losers |
Volume Leaders |
| + |
Microsoft Corp. 2.375% 2/12/2022 |
+ 0.4% |
| |
GE Capital Intl. Funding Co. 4.418% 11/15/2035 |
+ 0.0% |
| - |
Verizon Communications Inc. 4.522% 9/15/2048 |
-0.1% |
|
CVS Health Corp. 5.05% 3/25/2048
Microsoft Corp. 2.375% 2/12/2022
|
| Industry Returns Tracker |
| Industry |
Past Day |
Past Week |
Past Month |
Past Quarter |
YTD |
Past Year |
| Agriculture, Forestry, Fishing |
0.12% |
0.72% |
1.21% |
4.17% |
6.47% |
5.02% |
| Mining |
0.23% |
0.57% |
0.70% |
3.91% |
7.22% |
6.52% |
| Construction |
0.38% |
0.74% |
1.51% |
4.44% |
5.76% |
6.19% |
| Manufacturing |
0.32% |
0.72% |
1.13% |
3.76% |
5.63% |
5.82% |
| Transportion, Communication, Electric/Gas |
0.45% |
1.03% |
1.57% |
5.25% |
7.48% |
8.45% |
| Wholesale |
0.20% |
0.56% |
0.99% |
3.66% |
6.62% |
6.21% |
| Retail |
0.40% |
0.83% |
1.25% |
4.01% |
6.06% |
6.19% |
| Finance, Insurance, Real-Estate |
0.28% |
0.58% |
1.13% |
3.28% |
5.29% |
6.39% |
| Services |
0.37% |
0.86% |
1.43% |
3.88% |
5.81% |
6.81% |
| Public Administration |
0.33% |
0.62% |
1.21% |
2.51% |
2.74% |
4.43% |
| Energy |
0.21% |
0.58% |
0.74% |
4.01% |
7.42% |
8.22% |
| |
| Total returns (non-annualized) by rating, market weighted. |
|
| New Issues |
New Issues [Continued] |
|
1. Public Service Enterprise Group (USD) 2.875% 6/15/2024 (06/03/2019): 750MM Senior Unsecured Notes, Price at Issuance 99.953, Yielding 2.88%.
2. Home Depot Inc. (USD) 2.95% 6/15/2029 (06/03/2019): 1000MM Senior Unsecured Notes, Price at Issuance 99.426, Yielding 3.02%.
|
|
Additional Commentary
NEW ISSUANCE WATCH: on 6/3/19 participants welcome a $425MM new corporate-bond offering by Dayton Power & Light Co. The most recent data showed money flowed out of high-yield ETFs/mutual funds for the week ended 5/31/19, with a net outflow of $1.3B, year-to-date $9.8B flowed into high-yield.
| Top Widening Credit Default Swaps (CDS) |
Top Narrowing Credit Default Swaps (CDS) |
Weatherford International LTD (5Y Sen USD XR14)
Hertz Corp. (5Y Sen USD CR14) |
Cable & Wireless Communication (5Y Sen USD CR14)
SuperValu Inc. (5Y Sen USD MR14) |
Loans and Credit Market Overview
SYNDICATED LOANS HIGHLIGHTS:
Deals recently freed for secondary trading, notable secondary activity:
- Charles Schwab Corp., Tundra Energy Marketing , Louis Dreyfus Corp.
OVERALL CREDIT MARKET:Long-term bond yields are expected to hit a cyclical peak in 2019 given tight fiscal policy and lagging global economies. Europe remains checked by stubbornly low inflationary forces. Positive effects remained in force:
- TED spread held below 17 bp (basis points), as of 06/03/19
- Net positive capital flows into high-yield ETFs & mutual funds
Copyright 2019 Advantage Data Inc. All Rights Reserved. http://www.advantagedata.com
Information in this document should not be regarded as an offer to sell or solicitation of an offer to buy bonds or any financial instruments referred to herein. All information provided in this document is believed to be accurate. However, Advantage Data and its sources make no warranties, either express or implied, as to any matter whatsoever, including but not limited to warranties of merchantability or fitness for a particular purpose. Opinions in this document are subject to change without notice. Electronic redistribution, photocopying and any other electronic or mechanical reproduction is strictly prohibited without prior written permission from Advantage Data Inc.

.png)


