

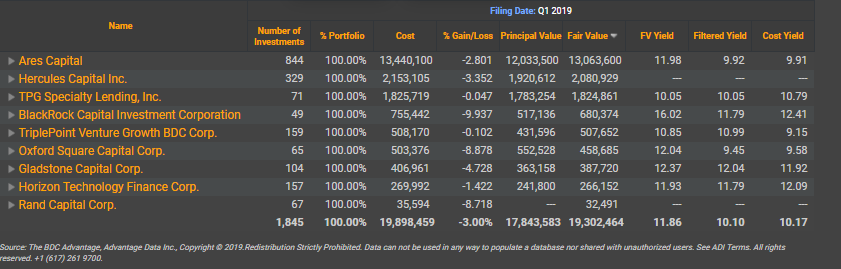
BDC Filing season is in full swing. This report will analyze nine BDCs that have filed this week. Aggregate Fair Value reported by these BDCs is 19.3 Billion USD which is approximately 20% of aggregate AUM of all BDCs.
Please contact info@advantagedata.com for BDC Holdings Data.
Non-Accruals
At least 5 BDC’s so far have reported Non –Accruals amounting to 536 Million USD in Principal Vale. Ares by far is leading the Non-Accruals list. Compared to Q4 18, Ares has reported 5 more Non-Accruals, adding 75 Million USD to its non-accruing Principal Value. TriplePoint and Gladstone Capital Corp combined have added 9 Million to their non-accruing Principal Value as of Q1 2019.
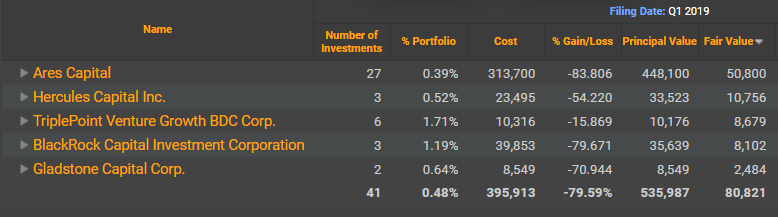
Non Accruals as Q1 2019
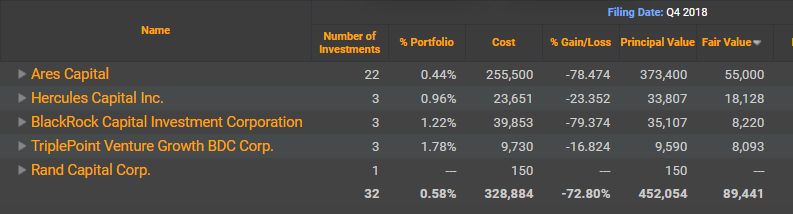
Non Accruals as Q4 2018
Please contact info@advantagedata.com for a complete list of Non- Accruals.
BDCs Investments Maturing in the next 12 Months
In the next 12 months, the aforementioned 9 BDC’s will have Investments worth 821 Million USD in Fair Value maturating. Below table summarizes aggregate Investments of BDCs that are maturing in the next 12 months.
|
BDC |
FV (1000) |
|
Ares Capital |
529,100 |
|
BlackRock Capital Investment Corporation |
8,117 |
|
Gladstone Capital Corp. |
18,068 |
|
Hercules Capital Inc. |
88,528 |
|
Horizon Technology Finance Corp. |
14,407 |
|
Rand Capital Corp. |
4,712 |
|
TPG Specialty Lending, Inc. |
79,912 |
|
TriplePoint Venture Growth BDC Corp. |
78,984 |
|
Grand Total |
821,828 |
Below Table refers to the Top 5 industries where investments are maturing in the next 12 months.
|
BDC |
FV (1000) |
|
Engineering services |
190,900 |
|
Services, not elsewhere classified |
148,200 |
|
Offices of holding companies, not elsewhere classified |
90,719 |
|
Molded, extruded, and lathe-cut mechanical rubber goods |
63,300 |
|
Business services, not elsewhere classified |
35,269 |
Top 5 BDC Investments
Top 5 Investments of the nine BDCs that have file in Q1 19 amount to 3.8 Billion USD accounting to 20% of their aggregate holdings.
|
RANK |
BDC |
Portfolio Company |
FV (1000) |
|
1 |
Ares Capital |
Senior Secured Loan Fund LLC |
791,900 |
|
2 |
Ares Capital |
Ivy Hill Asset Management |
534,000 |
|
3 |
Ares Capital |
Athenahealth Inc. |
368,500 |
|
4 |
Ares Capital |
MacLean Fogg Co. |
270,900 |
|
5 |
Ares Capital |
American Academy Hldgs LLC |
264,200 |
|
1 |
BlackRock Capital Investment Corporation |
Gordon Brothers Finance Co. |
153,358 |
|
2 |
BlackRock Capital Investment Corporation |
BCIC Senior Loan Partners LLC |
93,443 |
|
3 |
BlackRock Capital Investment Corporation |
First Boston Construction Holdings LLC |
47,508 |
|
4 |
BlackRock Capital Investment Corporation |
AGY Holding Corp. |
46,981 |
|
5 |
BlackRock Capital Investment Corporation |
Vertellus Specialties Inc. |
37,420 |
|
1 |
Gladstone Capital Corp. |
Imperative Hldgs Corp. |
32,314 |
|
2 |
Gladstone Capital Corp. |
IA Tech LLC |
30,450 |
|
3 |
Gladstone Capital Corp. |
Lignetics Inc. |
24,836 |
|
4 |
Gladstone Capital Corp. |
NetFortris Corp. |
24,086 |
|
5 |
Gladstone Capital Corp. |
EL Academies Inc. |
22,580 |
|
1 |
Hercules Capital Inc. |
Paratek Pharmaceuticals Inc. |
71,595 |
|
2 |
Hercules Capital Inc. |
EverFi Inc. |
61,662 |
|
3 |
Hercules Capital Inc. |
Bridgebio Pharma LLC |
57,824 |
|
4 |
Hercules Capital Inc. |
Businessolver.Com Inc. |
54,682 |
|
5 |
Hercules Capital Inc. |
Lithium Technology Corp. |
53,859 |
|
1 |
Horizon Technology Finance Corp. |
HealthEdge Software Inc. |
15,772 |
|
2 |
Horizon Technology Finance Corp. |
GroundTruth (xAd Inc.) |
15,038 |
|
3 |
Horizon Technology Finance Corp. |
Mohawk Group Inc. |
14,866 |
|
4 |
Horizon Technology Finance Corp. |
Mustang Bio Inc. |
14,800 |
|
5 |
Horizon Technology Finance Corp. |
Horizon Secured Loan Fund I LLC |
13,345 |
|
1 |
Oxford Square Capital Corp. |
Sound Point CLO XVI Ltd |
38,220 |
|
2 |
Oxford Square Capital Corp. |
Quest Software US Holdings Inc |
20,651 |
|
3 |
Oxford Square Capital Corp. |
Keystone Acquisition Corp |
19,862 |
|
4 |
Oxford Square Capital Corp. |
ECI Software |
19,613 |
|
5 |
Oxford Square Capital Corp. |
Lighthouse Network LLC |
19,567 |
|
1 |
Rand Capital Corp. |
Tilson Technology Mgmt Inc. |
4,960 |
|
2 |
Rand Capital Corp. |
Genicon Inc. |
3,465 |
|
3 |
Rand Capital Corp. |
ACV Auctions Inc. |
2,777 |
|
4 |
Rand Capital Corp. |
Microcision LLC |
2,548 |
|
5 |
Rand Capital Corp. |
Rheonix Inc. |
2,203 |
|
1 |
TPG Specialty Lending, Inc. |
Ferrellgas Partners LP |
84,188 |
|
2 |
TPG Specialty Lending, Inc. |
Nektar Therapeutics |
76,824 |
|
3 |
TPG Specialty Lending, Inc. |
Nintex Global LTD |
76,710 |
|
4 |
TPG Specialty Lending, Inc. |
Transform SR Holdings LLC |
75,000 |
|
5 |
TPG Specialty Lending, Inc. |
Motus LLC |
71,136 |
|
1 |
TriplePoint Venture Growth BDC Corp. |
US Treasury Bill |
49,994 |
|
2 |
TriplePoint Venture Growth BDC Corp. |
Prodigy Finance LTD |
40,857 |
|
3 |
TriplePoint Venture Growth BDC Corp. |
Viewray Inc. |
34,999 |
|
4 |
TriplePoint Venture Growth BDC Corp. |
Virtual Instruments Inc. |
31,035 |
|
5 |
TriplePoint Venture Growth BDC Corp. |
Adjust GmbH |
27,599 |
Adds & Exits
Below Table summarizes New Investments in Portfolio Companies by 9 BDCs that have filed as of Q1 19.
|
BDC |
FV (1000) |
|
Ares Capital |
1525200 |
|
BlackRock Capital Investment Corporation |
4638.376 |
|
Gladstone Capital Corp. |
36815 |
|
Hercules Capital Inc. |
20570 |
|
Horizon Technology Finance Corp. |
33085 |
|
Oxford Square Capital Corp. |
11615.22 |
|
Rand Capital Corp. |
4960.012 |
|
TPG Specialty Lending, Inc. |
130669 |
|
TriplePoint Venture Growth BDC Corp. |
66987 |
Below Table summarizes BDCs Exits in Portfolio Companies
|
BDC |
FV (1000) |
|
Ares Capital |
556,800 |
|
Gladstone Capital Corp. |
81,997 |
|
Hercules Capital Inc. |
30,909 |
|
Horizon Technology Finance Corp. |
4,158 |
|
Oxford Square Capital Corp. |
7,406 |
|
Rand Capital Corp. |
3,500 |
|
TPG Specialty Lending, Inc. |
26,945 |
|
TriplePoint Venture Growth BDC Corp. |
13,393 |
Please contact info@advantagedata.com for a complete list of BDCs New Investments and Exits.
.png)


