

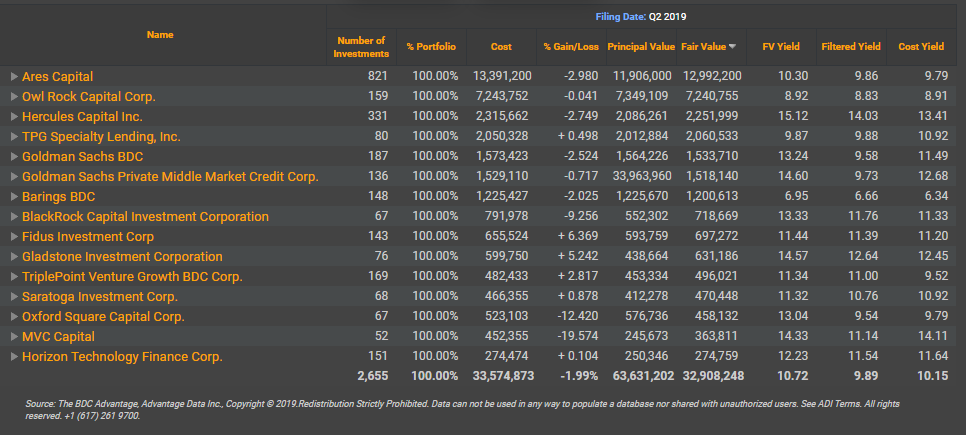
BDCs Filing season is in full swing. This report will utilize Advantage Data’s BDC workstation to analyze Q2 2019 filing data. As of Friday, August 2nd, 2019 Aggregate Fair Value reported by BDCs that have filed in Q2 2019 is at 33 Billion USD (Fair Value) which is approximately 31% of aggregate AUM of all BDCs.
 Please contact info@advantagedata.com for BDC Holdings Data.
Non-Accruals
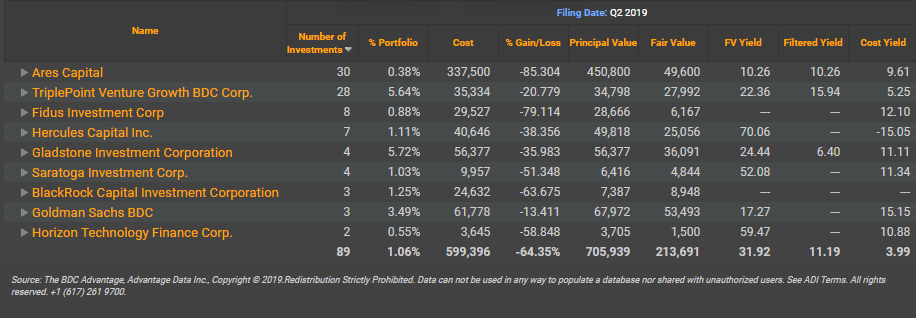
Out of 15 BDC’s that have filed so far, 9 BDC’s have reported at least one Non–Accrual in their portfolio. Aggregate Non-Accruals so far amounts to 599 Million USD in Cost. Fair Value of these Non-Accruals are reported at a significant Mark Down of 213 Million USD.
Ares, TriplePoint Venture Growth and Fidus Investment Corp. are leading the Non-Accruals list. Compared to Q1 2019, Ares has reported 2 more Non-Accruals while TriplePoint Venture Growth has reported 22 more Non-Accruals and Fidus Investment Corp has reported 6 more Non-Accruals in Q2 2019.
 Please contact info@advantagedata.com for a complete list of Portfolio Companies that are in Non-Accrual.
BDCs Investments Maturing in the next 12 Months
In the next 12 months, the aforementioned BDC’s will have Investments worth 1.2 Billion USD in Fair Value maturating. Below table summarizes aggregate Investments by Fair Value of BDCs in portfolio companies that are maturing in the next 12 months.
|
BDC |
FV (1000) |
|
Ares Capital |
596,400 |
|
Goldman Sachs BDC |
197,259 |
|
TPG Specialty Lending, Inc. |
169,739 |
|
Hercules Capital Inc. |
63,675 |
|
Gladstone Investment Corporation |
57,495 |
|
MVC Capital |
45,384 |
|
TriplePoint Venture Growth BDC Corp. |
43,286 |
|
Fidus Investment Corp |
33,910 |
|
Owl Rock Capital Corp. |
26,882 |
|
BlackRock Capital Investment Corporation |
24,966 |
|
Saratoga Investment Corp. |
19,234 |
|
Horizon Technology Finance Corp. |
8,883 |
|
Grand Total |
1,287,113 |
Below Table summarizes aggregate Investment Types by Fair Value held by BDCs that are maturing in the next 12 months.
|
BDC |
FV (1000) |
|
First Lien |
1,036,417 |
|
Second Lien |
82,164 |
|
Unitranche |
66,530 |
|
Subordinated Loan |
48,784 |
|
Subordinated Note |
41,710 |
|
Equity |
8,200 |
|
Senior Note |
3,308 |
|
Grand Total |
1,287,113 |
Where BDC are marking their Investments at?
Via below Table it can be inferred that while 94% of BDCs Investments at cost are marked at 91 and up, it is important to note that 3.62% of BDCs Investment at cost are marked at 80 or below.
|
Price Range |
Cost (1000) |
Cost |
Fair Value (1000) |
Fair Value |
|
>91 |
26,918,694 |
94.19% |
26,902,608 |
95.42% |
|
81-90 |
626,093 |
2.19% |
561,114 |
1.99% |
|
71-80 |
475,571 |
1.66% |
402,903 |
1.43% |
|
61-70 |
152,499 |
0.53% |
117,150 |
0.42% |
|
51-60 |
92,023 |
0.32% |
72,563 |
0.26% |
|
0-50 |
313,034 |
1.10% |
138,052 |
0.49% |
|
Grand Total |
28,577,914 |
100.00% |
28,194,390 |
100.00% |
Top 10 BDC Investments
BDCs portfolio quality can be measured by taking a deeper dive into BDC’s top ten investments. While these investments are small in number, these investments are primary determinants of BDC’s portfolio performance. Top 10 Investments of BDCs that have filed so far in Q2 2019 amount to 9.8 Billion USD accounting to 29% of their aggregate holdings.
Please click below to download data.

.png)


