THE MARKETS ROSE THEN FELL SHARPLY TODAY after the White House announced an additional 10% Tariff on Chinese goods beginning next month. The news came after a 300 point rebound from Wednesday’s interest rate cut-related losses.The 10-Year US Treasury note fell 11.3 basis points. S&P -0.90%, DOW -1.05%, NASDAQ -0.79%
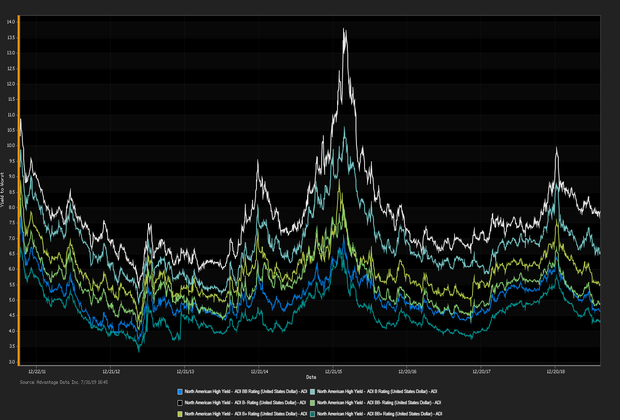
IN THE CORPORATE BOND SPACE, Ryder System Inc. (NYSE: R) priced $550 million worth of senior unsecured notes that will yield 2.5% and mature on September 1, 2024. This pricing comes 2 days after the transportation and supply chain management company reported record high Q2 revenue. According to CEO Robert Sanchez, “Despite a softer freight environment compared to 2018, we delivered double-digit operating revenue growth driven by strong performance in our contractual dedicated transportation, supply chain and lease businesses”. ADI proprietary index data showed a net yield increment for high-grade versus high-yield bonds. High-grade edged out high-yield. Among high-grade bonds showing topmost price gains at appreciable volumes traded, MetLife Inc. (USD) 2.463% 12/15/2044 made analysts' 'Conviction Buy' lists. (See the chart for ADI indexes above.) Andrew Robartes
| Key Gainers and Losers |
Volume Leaders |
| + |
Petrobras Global Finance BV 6.85% 6/5/2115 |
+ 0.9% |
| |
Discover Financial Services 4.1% 2/9/2027 |
+ 0.6% |
| - |
Dish DBS Corp. 7.75% 7/1/2026 |
-3.5% |
| |
Antero Resources Corp. 5.125% 12/1/2022 |
-1.3% |
|
Discover Financial Services 4.1% 2/9/2027
Western Digital Corp. 4.75% 2/15/2026
|
| Industry Returns Tracker |
| Industry |
Past Day |
Past Week |
Past Month |
Past Quarter |
YTD |
Past Year |
| Agriculture, Forestry, Fishing |
-0.05% |
-0.25% |
-0.05% |
5.31% |
11.98% |
12.26% |
| Mining |
0.30% |
-0.10% |
-1.63% |
-2.99% |
6.93% |
0.98% |
| Construction |
0.05% |
0.09% |
0.80% |
2.88% |
11.67% |
9.41% |
| Manufacturing |
0.02% |
0.17% |
0.06% |
1.51% |
9.50% |
7.23% |
| Transportion, Communication, Electric/Gas |
0.10% |
0.06% |
0.60% |
3.04% |
11.18% |
8.71% |
| Wholesale |
-0.02% |
0.05% |
0.54% |
2.72% |
11.13% |
7.81% |
| Retail |
-0.03% |
0.07% |
0.28% |
2.24% |
12.87% |
9.47% |
| Finance, Insurance, Real-Estate |
0.04% |
0.12% |
0.88% |
2.84% |
11.05% |
8.94% |
| Services |
0.01% |
0.07% |
0.51% |
2.40% |
10.16% |
8.17% |
| Public Administration |
0.52% |
0.93% |
2.16% |
5.38% |
11.81% |
13.05% |
| Energy |
0.30% |
-0.06% |
-1.48% |
-2.12% |
7.46% |
1.92% |
| |
| Total returns (non-annualized) by rating, market weighted. |
|
| New Issues |
Forward Calendar |
|
1. Advisor Group (USD) 10.75% 8/1/2027 144A (07/31/2019): 350MM Senior Unsecured Notes, Price at Issuance 96.14, Yielding 11.49%.
|
1. DDM Holding AG: ¬100MM, Expected Q3 2019
2. General Electric Distributed Power: $600M high-yield bonds, Expected Q3 2019
|
Additional Commentary
NEW ISSUANCE WATCH: on 7/31/19 participants welcome a $350MM new corporate-bond offering by
Advisor Group. The most recent data showed money flowed out of high-yield ETFs/mutual funds for the week ended 7/26/19, with a net inflow of $1.3B, Seven week total $9.0B flowed into high-yield.
| Top Widening Credit Default Swaps (CDS) |
Top Narrowing Credit Default Swaps (CDS) |
Hertz Corp. (5Y Sen USD XR14)
Hovnanian Enterprises Inc. (5Y Sen USD MR14) |
Road King Infrastructure LTD (5Y Sen USD MR14)
Cable & Wireless Communication (5Y Sen USD CR14) |
Loans and Credit Market Overview
SYNDICATED LOANS HIGHLIGHTS:
Deals recently freed for secondary trading, notable secondary activity:
- London Stock Exchange Group PLC, Maxamcorp Holding SL, PLZ Aeroscience Corp.
OVERALL CREDIT MARKET:Long-term bond yields are expected to hit a cyclical peak in 2019 given tight fiscal policy and lagging global economies. Europe remains checked by stubbornly low inflationary forces. Positive effects remained in force:
- TED spread held below 21 bp (basis points), as of 08/01/19
- Net positive capital flows into high-yield ETFs & mutual funds
Copyright 2019 Advantage Data Inc. All Rights Reserved. http://www.advantagedata.com
Information in this document should not be regarded as an offer to sell or solicitation of an offer to buy bonds or any financial instruments referred to herein. All information provided in this document is believed to be accurate. However, Advantage Data and its sources make no warranties, either express or implied, as to any matter whatsoever, including but not limited to warranties of merchantability or fitness for a particular purpose. Opinions in this document are subject to change without notice. Electronic redistribution, photocopying and any other electronic or mechanical reproduction is strictly prohibited without prior written permission from Advantage Data Inc.

.png)


