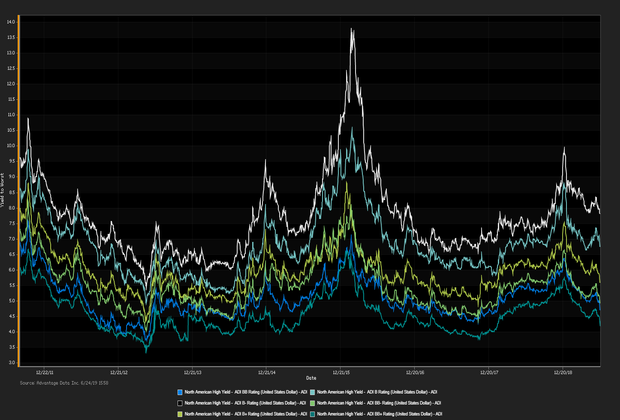
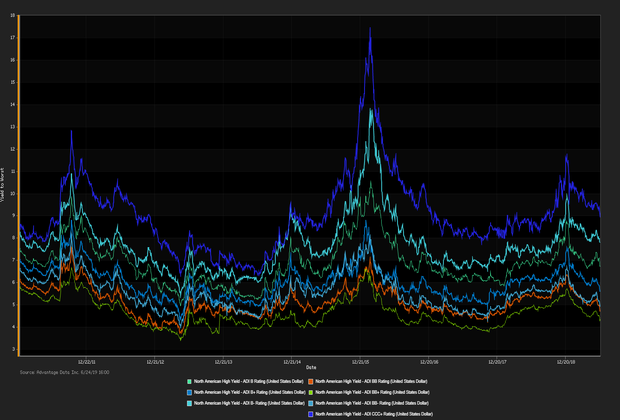
THE YIELD GAP BETWEEN INVESTMENT GRADE and high yield corporate bonds is at its lowest since 2007. Just 60 basis points separate yields of the lowest-rated investment grade debt and the highest-rated high yield debt. As trends among corporate and government debt continue to point to economic downturn, many investors are selling riskier junk bonds. S&P +0.46%, DOW +0.90, NASDAQ +0.59%
IN CORPORATE BOND NEW ISSUANCE, E.W. Scripps Company
priced $500 million in senior notesthrough its subsidiary company, Escrow Inc. The notes, which were upsized by $100 million due to strong demand, will
yield 5.875% and mature on July 15, 2027. Scripps plans to use the proceeds in part to
facilitate the acquisition of 8 television stations, and to repay outstanding debt. ADI proprietary index data showed a net
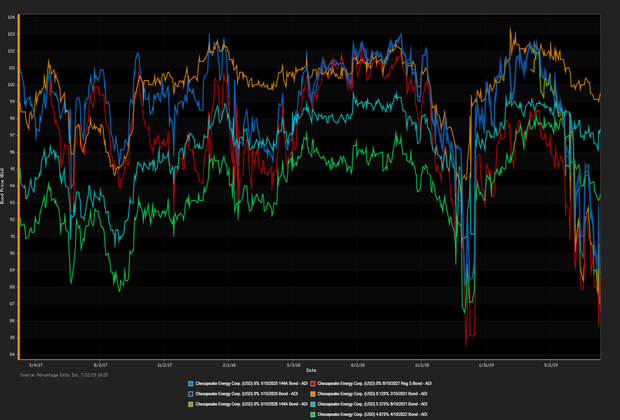
yield increment for high-yield versus high-grade bonds. High-yield edged out high-grade. Among high-yield bonds showing topmost price gains at appreciable volumes traded,
Chesapeake Energy Corp. (USD) 7.5% 10/1/2026 made analysts' 'Conviction Buy' lists. (See the chart for
Chesapeake Energy Corp. bonds below.)
Andrew Robartes (
arobartes@advantagedata.com).
| Key Gainers and Losers |
Volume Leaders |
| + |
US Steel Corp. 6.875% 8/15/2025 |
+ 0.2% |
| |
Sprint Nextel Corp. 7.875% 9/15/2023 |
+ 0.4% |
| - |
Antero Resources Finance Corp. 5.375% 11/1/2021 |
-0.0% |
| |
Citigroup Inc. 5.875% PERP |
-0.6% |
|
EMC Corp. 2.65% 6/1/2020
Olin Corp. 5.125% 9/15/2027
|
| Industry Returns Tracker |
| Industry |
Past Day |
Past Week |
Past Month |
Past Quarter |
YTD |
Past Year |
| Agriculture, Forestry, Fishing |
-0.04% |
-0.09% |
4.80% |
5.63% |
12.45% |
14.30% |
| Mining |
-0.09% |
-0.80% |
-0.45% |
-2.29% |
6.88% |
1.28% |
| Construction |
-0.04% |
0.01% |
1.49% |
3.19% |
11.25% |
9.22% |
| Manufacturing |
-0.12% |
-0.28% |
1.05% |
1.84% |
9.15% |
7.53% |
| Transportion, Communication, Electric/Gas |
-0.16% |
-0.29% |
1.52% |
3.03% |
10.40% |
9.29% |
| Wholesale |
-0.02% |
-0.20% |
1.25% |
2.89% |
10.57% |
7.62% |
| Retail |
-0.05% |
-0.44% |
0.85% |
3.28% |
12.52% |
9.59% |
| Finance, Insurance, Real-Estate |
-0.07% |
-0.23% |
1.54% |
2.57% |
10.37% |
9.50% |
| Services |
-0.10% |
-0.20% |
0.85% |
2.13% |
9.89% |
8.90% |
| Public Administration |
-0.08% |
-0.28% |
1.66% |
3.91% |
9.98% |
13.27% |
| Energy |
-0.13% |
-0.87% |
-0.30% |
-1.35% |
7.20% |
1.89% |
| |
| Total returns (non-annualized) by rating, market weighted. |
|
| New Issues |
Forward Calendar |
|
1. Masonite Intl. Corp. (USD) 5.375% 2/1/2028 144A (07/11/2019):500MM Senior Unsecured Notes, Price at Issuance 100, Yielding 5.38%.
2. Olin Corp. (USD) 5.627% 8/1/2029 (07/11/2019): 750MM Senior Unsecured Notes, Price at Issuance 100, Yielding 5.63%.
|
1. Atlantica Tender Drilling Ltd: $140MM, Expected Q3 2019
2. Calpine Corp.: $1.4B bonds, Expected Q2 2019
|
Additional Commentary
NEW ISSUANCE WATCH: on 7/12/19 participants welcome a $600MM new corporate-bond offering by Horizon Pharma Inc. The most recent data showed money flowed out of high-yield ETFs/mutual funds for the week ended 6/21/19, with a net outflow of $602MM, year-to-date $8.9B flowed into high-yield.
| Top Widening Credit Default Swaps (CDS) |
Top Narrowing Credit Default Swaps (CDS) |
Rite Aid Corp. (5Y Sen USD XR14)
Hertz Corp. (5Y Sen USD CR14) |
SuperValu Inc. (5Y Sen USD XR14)
Atmos Energy Corp. (5Y Sen USD MR14) |
Loans and Credit Market Overview
SYNDICATED LOANS HIGHLIGHTS:
Deals recently freed for secondary trading, notable secondary activity:
- Starwood Property Trust Inc., Heritage Power, LLC, Piaggio & C. SpA, Goshawk Aviation Ltd
OVERALL CREDIT MARKET:Long-term bond yields are expected to hit a cyclical peak in 2019 given tight fiscal policy and lagging global economies. Europe remains checked by stubbornly low inflationary forces. Positive effects remained in force:
- TED spread held below 17 bp (basis points), as of 07/12/19
- Net positive capital flows into high-yield ETFs & mutual funds
Copyright 2019 Advantage Data Inc. All Rights Reserved. http://www.advantagedata.com
Information in this document should not be regarded as an offer to sell or solicitation of an offer to buy bonds or any financial instruments referred to herein. All information provided in this document is believed to be accurate. However, Advantage Data and its sources make no warranties, either express or implied, as to any matter whatsoever, including but not limited to warranties of merchantability or fitness for a particular purpose. Opinions in this document are subject to change without notice. Electronic redistribution, photocopying and any other electronic or mechanical reproduction is strictly prohibited without prior written permission from Advantage Data Inc.

.png)


