US INVESTMENT GRADE DEBT ROSE AGAINST JUNK BONDS in net prices linked to actual trades after the European Central Bank President Mario Draghi announced the possibility of more stimulus if inflation stays low. US Treasury prices rallied for the second day as the Fed kicks off its two-day meeting. The 10-year note dipped 3.2 basis points. S&P +0.98%, DOW +1.36, NASDAQ +1.42%.
US HOUSING STARTS DECLINE IN MAY revealing the latest weakness in the housing market following a
weak builder confidence report earlier this month. In spite of
the 0.9 percent drop, the Fed revised April’s and May’s data indicating
more housing starts than previously reported. The construction industry is facing a
significant labor shortage preventing builders to take advantage of low-interest rates and a tight housing market.
Crude oil spiked on Tuesday rising
4.14 percent as investors become
optimistic over the US and China making progress following communication from the White House.
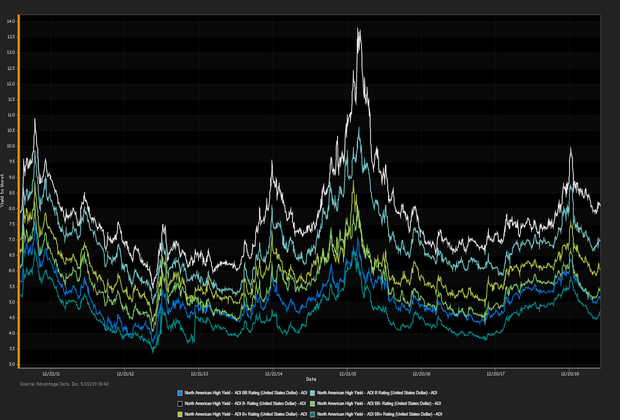
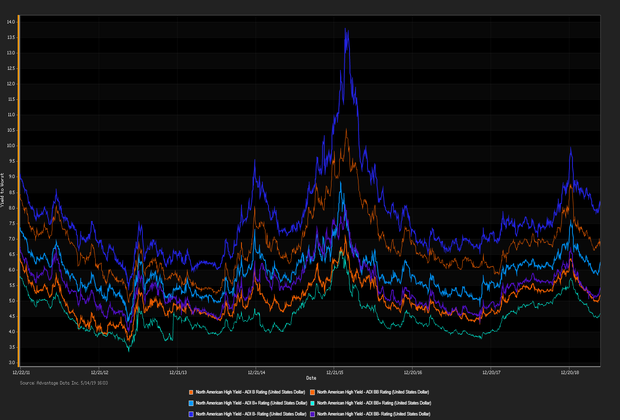
ADI proprietary index data showed a net
yield increment for high-yield versus high-grade bonds. High-grade edged out high-yield. Among high-grade bonds showing topmost price gains at appreciable volumes traded,
Transcontinental Gas Pipe Corp. (USD) 5.4% 8/15/2041 made analysts' 'Conviction Buy' lists. (See the chart for
ADI indexes
above.)
Corey Mahoney (
cmahoney@advantagedata.com).
| Key Gainers and Losers |
Volume Leaders |
| + |
Petrobras Global Finance BV 6.85% 6/5/2115 |
+ 1.6% |
| |
Sprint Nextel Corp. 6% 11/15/2022 |
+ 1.7% |
| - |
Frontier Communications Corp. 10.5% 9/15/2022 |
-0.3% |
|
Dish DBS Corp. 7.75% 7/1/2026
PetSmart Inc. 5.875% 6/1/2025 144A
|
| Industry Returns Tracker |
| Industry |
Past Day |
Past Week |
Past Month |
Past Quarter |
YTD |
Past Year |
| Agriculture, Forestry, Fishing |
0.20% |
2.01% |
3.88% |
3.75% |
8.68% |
10.45% |
| Mining |
-0.33% |
-0.93% |
-2.67% |
-0.65% |
6.13% |
0.87% |
| Construction |
-0.05% |
0.15% |
1.23% |
3.60% |
8.90% |
6.47% |
| Manufacturing |
-0.03% |
0.04% |
0.44% |
1.81% |
7.91% |
5.86% |
| Transportion, Communication, Electric/Gas |
0.04% |
-0.04% |
1.29% |
3.14% |
8.84% |
7.37% |
| Wholesale |
0.03% |
0.28% |
1.22% |
3.06% |
9.37% |
6.03% |
| Retail |
-0.09% |
0.12% |
0.86% |
4.08% |
11.07% |
7.81% |
| Finance, Insurance, Real-Estate |
-0.02% |
0.16% |
1.07% |
2.66% |
8.96% |
8.18% |
| Services |
-0.05% |
0.10% |
1.43% |
2.63% |
8.96% |
7.77% |
| Public Administration |
0.32% |
0.64% |
1.57% |
2.96% |
8.64% |
13.83% |
| Energy |
-0.28% |
-0.86% |
-2.51% |
-0.57% |
5.95% |
0.62% |
| |
| Total returns (non-annualized) by rating, market weighted. |
|
| New Issues |
Forward Calendar |
|
1. Cedar Fair LP (USD) 5.25% 7/15/2029 144A (06/18/2019): 500MM Senior Unsecured Notes, Price at Issuance 100, Yielding 5.25%.
2. Labl Escrow Issuer, LLC (USD) 10.5% 7/15/2027 144A (06/18/2019): 690MM Senior Unsecured Notes, Price at Issuance 100, Yielding 10.5%.
|
1. Q'Max Solutions Inc.: $225MM, Expected Week of 6/17
2. Petroleum Geo-Services: $150MM, Expected Week of 6/17
|
Additional Commentary
NEW ISSUANCE WATCH: on 6/18/19 participants welcome a $1500MM new corporate-bond offering by Sirius XM Radio Inc. The most recent data showed money flowed out of high-yield ETFs/mutual funds for the week ended 6/7/19, with a net outflow of $3.2B, year-to-date $6.6B flowed into high-yield.
| Top Widening Credit Default Swaps (CDS) |
Top Narrowing Credit Default Swaps (CDS) |
Hertz Corp. (5Y Sen USD XR14)
Hovnanian Enterprises Inc. (5Y Sen USD XR14) |
SuperValu Inc. (5Y Sen USD MR14)
San Miguel Corp. (5Y Sen USD CR14) |
Loans and Credit Market Overview
SYNDICATED LOANS HIGHLIGHTS:
Deals recently freed for secondary trading, notable secondary activity:
- Perforce Software Inc., Avantor Performance Materials Inc., United PF Holdings LLC
Long-term bond yields are expected to hit a cyclical peak in 2019 given tight fiscal policy and lagging global economies. Europe remains checked by stubbornly low inflationary forces. Positive effects remained in force:
- TED spread held below 24 bp (basis points), as of 06/18/19
- Net positive capital flows into high-yield ETFs & mutual funds
Copyright 2019 Advantage Data Inc. All Rights Reserved. http://www.advantagedata.com
Information in this document should not be regarded as an offer to sell or solicitation of an offer to buy bonds or any financial instruments referred to herein. All information provided in this document is believed to be accurate. However, Advantage Data and its sources make no warranties, either express or implied, as to any matter whatsoever, including but not limited to warranties of merchantability or fitness for a particular purpose. Opinions in this document are subject to change without notice. Electronic redistribution, photocopying and any other electronic or mechanical reproduction is strictly prohibited without prior written permission from Advantage Data Inc.

.png)


