
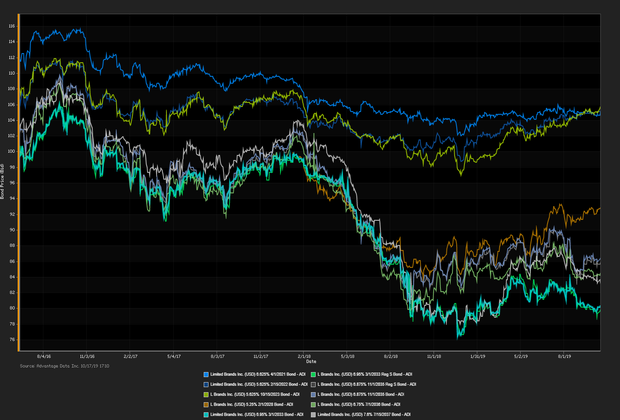
JOBLESS CLAIMS RISE MARGINALLY IN OCTOBER ticking higher by 4,000 applications during the week end of October 11th. A General Motors strike caused a slight increase of claims in Ohio and Michigan however, the impact won’t be seen until the end of the month. United Auto Workers, the General Motors Union delivered a tentative deal including the closure of multiple U.S. plants and a “ratification” bonus to union members. High-yield edged out high-grade. Among high-grade bonds showing topmost price gains at appreciable volumes traded, L Brands Inc. (USD) 6.875% 11/1/2035 analysts' 'Conviction Buy' list (See the chart below for L Brands Inc. bonds.) Corey Mahoney
| Key Gainers and Losers | Volume Leaders | ||||||||||||
|---|---|---|---|---|---|---|---|---|---|---|---|---|---|
|
Gulfport Energy Corp. 6.625% 5/1/2023 Intelsat Luxembourg SA 8.125% 6/1/2023 |
| Industry Returns Tracker | ||||||||||||||||||||||||||||||||||||||||||||||||||||||||||||||||||||||||||||||||||||||||||||||||||
|---|---|---|---|---|---|---|---|---|---|---|---|---|---|---|---|---|---|---|---|---|---|---|---|---|---|---|---|---|---|---|---|---|---|---|---|---|---|---|---|---|---|---|---|---|---|---|---|---|---|---|---|---|---|---|---|---|---|---|---|---|---|---|---|---|---|---|---|---|---|---|---|---|---|---|---|---|---|---|---|---|---|---|---|---|---|---|---|---|---|---|---|---|---|---|---|---|---|---|
|
||||||||||||||||||||||||||||||||||||||||||||||||||||||||||||||||||||||||||||||||||||||||||||||||||
| New Issues | Forward Calendar |
|---|---|
|
1. CCO Holdings LLC (USD) 4.75% 3/1/2030 (10/16/2019): 500MM Senior Unsecured Notes, Price at Issuance 101.25, Yielding 4.6%. 2. Motion Bondco Designated Activity Company (USD) 6.625% 11/15/2027 Reg S (10/16/2019): 410MM Secured Notes, Price at Issuance 100, Yielding 6.63%. |
1. Qmax Financial Holdings Inc.: $225MM, Expected 4th Quarter 2019 |
Additional Commentary
Truckpro Inc. The most recent data showed a money flowed out of highyoutflow ETF/mutual funds for the week ended 9/27/2019, with a net outflow of $258 million.
| Top Widening Credit Default Swaps (CDS) | Top Narrowing Credit Default Swaps (CDS) |
| Rite Aid Corp. (5Y Sen USD MR14) Hertz Corp. (5Y Sen USD CR14) |
Ghana, Republic of (5Y Sen USD CR14) Export Credit Bank of Turkey (5Y Sen USD CR14) |
Loans and Credit Market Overview
Deals recently freed for secondary trading, notable secondary activity:
- Live Nation Entertainment Inc., Berry Plastics Corp., Raytheon Co., Shearer's Foods Inc.
Long-term bond yields are expected to hit a cyclical peak in 2019 given tight fiscal policy and lagging global economies. Europe remains checked by stubbornly low inflationary forces. Positive effects remained in force:
- TED spread held below 35 bp (basis points), as of 10/17/19
- Net positive capital flows into high-yield ETFs & mutual funds
Copyright 2019 Advantage Data Inc. All Rights Reserved. http://www.advantagedata.com
Information in this document should not be regarded as an offer to sell or solicitation of an offer to buy bonds or any financial instruments referred to herein. All information provided in this document is believed to be accurate. However, Advantage Data and its sources make no warranties, either express or implied, as to any matter whatsoever, including but not limited to warranties of merchantability or fitness for a particular purpose. Opinions in this document are subject to change without notice. Electronic redistribution, photocopying and any other electronic or mechanical reproduction is strictly prohibited without prior written permission from Advantage Data Inc.
.png)


