CONSUMER BORROWING RISES IN JULY as Americans racked up credit card debt surging 11.2 percent. Additionally, borrowing increased at the fastest rate in almost 2 years. Overall consumer credit growth clocked in at 6.8 percent up from 4.1 percent in June. Home purchasing sentiment ticks higher as mortgage rates fall upon global uncertainty, “We do expect housing market activity to remain relatively stable, and the favorable rate environment should continue supporting increased refinance activity,” Fannie Mae chief economist Doug Duncan. The 10-year note rose 7.8 basis points. S&P -0.17%, DOW +0.07, NASDAQ -0.56%.
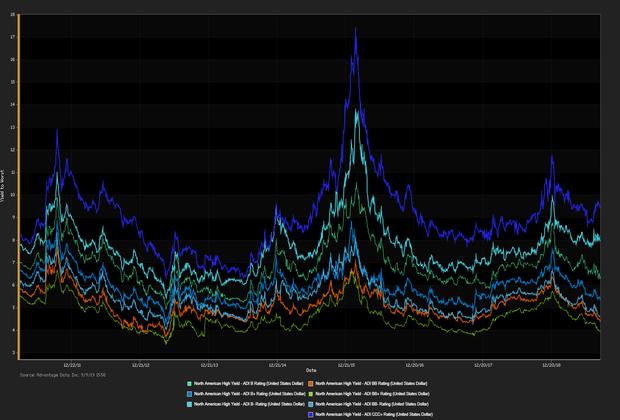
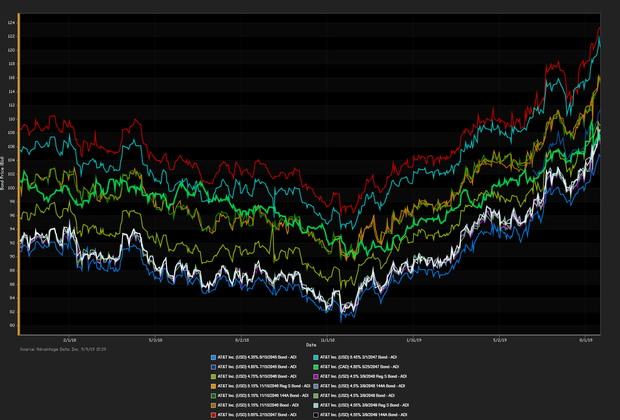
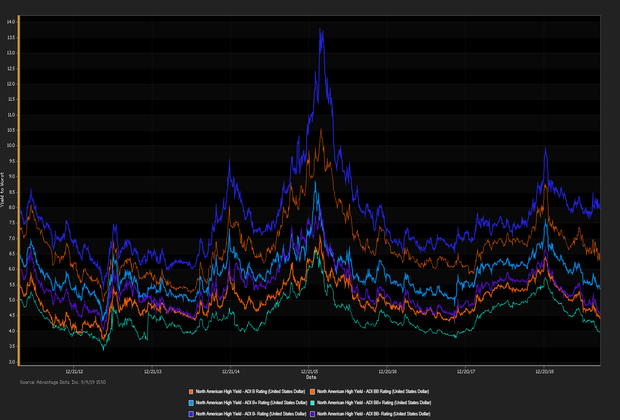
AT&T BONDS TRADED NOTABLY HIGHER ON MONDAY following activist investor Elliot Management a hedge fund disclosed a $3.2 billion stake. The fund sent a letter to AT&T explaining its Activating AT&T Plan and the opportunity ahead as it believes the stock is “deeply undervalued”. (See AT&T Bonds Below) WTI Crude advanced 2.49 percent rallying after the new Saudi Energy minister pledges to maintain output cuts, “Its almost certain that policy will not change,” said one OPEC official. Saudi Arabia, the world’s largest oil exporter has taken a back seat pumping out less than 10 million barrels a day significantly less than the OPEC allotment. ADI proprietary index data showed a net yield increment for high-grade versus high-yield bonds. High-yield edged out high-grade. Among high-yield bonds showing topmost price gains at appreciable volumes traded, Whiting Petroleum Corp. (USD) 6.625% 1/15/2026 made analysts' 'Conviction Buy' list (See the chart below for AT&T bonds below) Corey Mahoney
| Key Gainers and Losers |
Volume Leaders |
| + |
Meritor Inc. 6.25% 2/15/2024 |
+ 0.5% |
| |
Pacific Gas & Electric Co. 6.05% 3/1/2034 |
+ 0.6% |
| - |
ArcelorMittal SA 6.125% 6/1/2025 |
-0.8% |
|
Chemours Co. LLC 6.625% 5/15/2023
Icahn Enterprises LP 5.875% 2/1/2022
|
| Industry Returns Tracker |
| Industry |
Past Day |
Past Week |
Past Month |
Past Quarter |
YTD |
Past Year |
| Agriculture, Forestry, Fishing |
0.22% |
0.89% |
2.29% |
7.46% |
14.34% |
16.64% |
| Mining |
0.03% |
-0.25% |
-0.62% |
-2.19% |
5.09% |
-0.10% |
| Construction |
-0.00% |
0.18% |
1.84% |
4.60% |
13.69% |
10.95% |
| Manufacturing |
0.12% |
0.08% |
1.34% |
2.97% |
10.61% |
7.76% |
| Transportion, Communication, Electric/Gas |
0.08% |
0.16% |
1.40% |
4.31% |
13.25% |
10.16% |
| Wholesale |
0.06% |
0.08% |
0.83% |
2.98% |
11.37% |
7.30% |
| Retail |
0.07% |
0.25% |
1.10% |
3.21% |
14.26% |
11.01% |
| Finance, Insurance, Real-Estate |
0.05% |
0.27% |
1.44% |
4.22% |
12.56% |
10.55% |
| Services |
0.04% |
0.25% |
1.74% |
3.71% |
12.05% |
9.47% |
| Public Administration |
0.02% |
0.03% |
1.33% |
5.15% |
13.07% |
17.63% |
| Energy |
0.05% |
-0.20% |
-0.27% |
-1.14% |
6.40% |
1.15% |
| |
| Total returns (non-annualized) by rating, market weighted. |
|
| New Issues |
Forward Calendar |
|
(None Current 09/09/2019)
|
1. Diamondback Energy Inc.: High-yield notes, Expected Q3 2019
2. Calpine Corp.: $1.4B bonds, Expected Q3 2019
|
Additional Commentary
NEW ISSUANCE WATCH: on 09/05/19 participants welcome a $425M new corporate-bond offering by
Hill-Rom Holdings Inc. .
The most recent data showed a significant flow into fixed income ETFs for the month of August, with a net inflow of $14.0 billion.
| Top Widening Credit Default Swaps (CDS) |
Top Narrowing Credit Default Swaps (CDS) |
Weatherford International LTD (5Y Sen USD XR14)
Hertz Corp. (5Y Sen USD CR14) |
SuperValu Inc. (5Y Sen USD MR14)
San Miguel Corp. (5Y Sen USD CR14) |
Loans and Credit Market Overview
SYNDICATED LOANS HIGHLIGHTS:
Deals recently freed for secondary trading, notable secondary activity:
- Murphy Oil USA Inc., Electronic Arts Inc., AutoData, PaySimple Inc., Nike Inc., US Foods Inc.
OVERALL CREDIT MARKET:Long-term bond yields are expected to hit a cyclical peak in 2019 given tight fiscal policy and lagging global economies. Europe remains checked by stubbornly low inflationary forces. Positive effects remained in force:
- TED spread held below 19 bp (basis points), as of 09/09/19
- Net positive capital flows into high-yield ETFs & mutual funds
Copyright 2019 Advantage Data Inc. All Rights Reserved. http://www.advantagedata.com
Information in this document should not be regarded as an offer to sell or solicitation of an offer to buy bonds or any financial instruments referred to herein. All information provided in this document is believed to be accurate. However, Advantage Data and its sources make no warranties, either express or implied, as to any matter whatsoever, including but not limited to warranties of merchantability or fitness for a particular purpose. Opinions in this document are subject to change without notice. Electronic redistribution, photocopying and any other electronic or mechanical reproduction is strictly prohibited without prior written permission from Advantage Data Inc.

.png)


