U.S. TREASURY YIELDS ACROSS the board settled lower following the sale of $40 billion of 2-year notes; the 2-year note sank 4.6 basis points and 10-year note dipped 2.2 basis points. S&P and NASDAQ surged past record highs on Tuesday on upbeat earnings relieving anxiety on a gloomy earnings season. S&P +0.88%, DOW +0.55%, NASDAQ +1.32%
.png?width=620&name=unnamed%20(93).png)
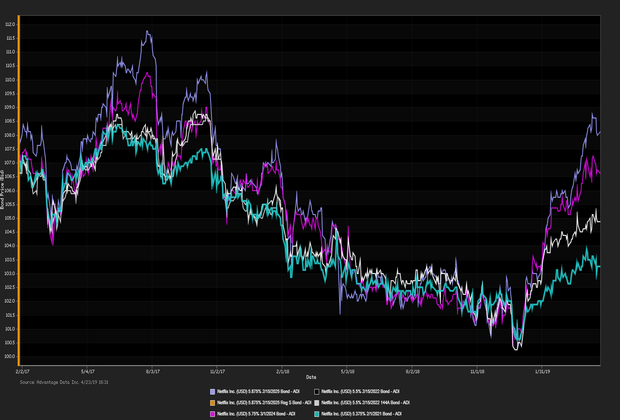
NETFLIX WILL BE OFFERING $2 BILLION in senior unsecured debt rated
Ba3 by Moody’s, three tiers below investment grade given the online media provider is
7.5x levered. Subsequently Netflix (
NFLX) fell in premarket trading but quickly recovering
rallying 1.9 percent during mid-day trading. Moody’s remains optimistic on Netflix’s long-term strategy,
“Despite the continuing issuances of debt to fund the company’s negative cash flows, we expect leverage to drop gradually over time with subscriber growth”. New home sales flirt with a
one and a half year high, rising for the third consecutive month aided by lower mortgage rates and a cooling market. The median
price of a new construction declined 9.7 percent in March year over year.
ADI proprietary index data showed a net
yield increment for high-yield versus high-grade bonds.
High-grade edged out high-yield. Among high-grade bonds showing topmost price gains at appreciable volumes traded,
Gulf Power Co. (USD) 4.55% 10/1/2044 made analysts' 'Conviction Buy' lists. (See the chart for
Netflix bonds below)
Corey Mahoney cmahoney@advantagedata.com).
| Key Gainers and Losers |
Volume Leaders |
| + |
CVS Health Corp. 5.05% 3/25/2048 |
+ 0.4% |
| |
Comcast Corp. 4.15% 10/15/2028 |
+ 0.4% |
| - |
Lockheed Martin Corp. 3.35% 9/15/2021 |
-0.6% |
|
Molson Coors Brewing Co. 2.25% 3/15/2020
Celgene Corp. 3.875% 8/15/2025
|
| Industry Returns Tracker |
| Industry |
Past Day |
Past Week |
Past Month |
Past Quarter |
YTD |
Past Year |
| Agriculture, Forestry, Fishing |
-0.10% |
-0.25% |
0.41% |
4.05% |
4.49% |
4.63% |
| Mining |
-0.06% |
-0.18% |
0.73% |
4.38% |
5.94% |
5.56% |
| Construction |
-0.02% |
0.06% |
0.51% |
3.54% |
3.99% |
4.75% |
| Manufacturing |
-0.10% |
-0.18% |
0.33% |
3.52% |
4.14% |
4.56% |
| Transportion, Communication, Electric/Gas |
-0.09% |
-0.06% |
0.53% |
4.46% |
5.14% |
6.01% |
| Wholesale |
-0.04% |
-0.06% |
0.40% |
3.64% |
4.53% |
4.55% |
| Retail |
-0.09% |
-0.20% |
0.21% |
3.49% |
4.08% |
4.92% |
| Finance, Insurance, Real-Estate |
-0.05% |
-0.09% |
0.27% |
3.10% |
3.68% |
5.17% |
| Services |
-0.09% |
-0.23% |
0.12% |
3.03% |
3.74% |
5.36% |
| Public Administration |
-0.02% |
0.02% |
0.01% |
1.14% |
1.03% |
3.64% |
| Energy |
-0.08% |
-0.28% |
0.62% |
4.60% |
6.04% |
6.02% |
| |
| Total returns (non-annualized) by rating, market weighted. |
|
| New Issues |
New Issues [Continued] |
|
1. Kimberly-Clark Corp. (USD) 3.2% 4/25/2029 (04/23/2019): 700MM Senior Unsecured Notes, Price at Issuance 99.83, Yielding 3.22%.
2. Rogers Communications Inc. (USD) 4.35% 5/1/2049 (04/23/2019):1250MM Senior Unsecured Notes, Price at Issuance 99.667, Yielding 4.37%.
|
|
Additional Commentary
NEW ISSUANCE WATCH: on 4/23/19 participants welcome a $700MM new corporate-bond offering by
Kimberly-Clark Corp. The most recent data showed money flowed out of high-yield ETFs/mutual funds for the week ended 4/18/19, with a net inflow of $1.1B, year-to-date $14.4B flowed into high-yield.
| Top Widening Credit Default Swaps (CDS) |
Top Narrowing Credit Default Swaps (CDS) |
Weatherford International LTD (5Y Sen USD XR14)
Hertz Corp. (5Y Sen USD CR14) |
SuperValu Inc. (5Y Sen USD MR14)
Atmos Energy Corp. (5Y Sen USD MR14) |
Loans and Credit Market Overview
SYNDICATED LOANS HIGHLIGHTS:
Deals recently freed for secondary trading, notable secondary activity:
- Prysmian, Project Maple II BV, Trade Me Group LTD, Jane Street, Six Flags Inc.
Long-term bond yields are expected to hit a cyclical peak in 2019 given tight fiscal policy and lagging global economies. Europe remains checked by stubbornly low inflationary forces. Positive effects remained in force:
- TED spread held below 17 bp (basis points), as of 04/23/19
- Net positive capital flows into high-yield ETFs & mutual funds
Copyright 2019 Advantage Data Inc. All Rights Reserved. http://www.advantagedata.com
Information in this document should not be regarded as an offer to sell or solicitation of an offer to buy bonds or any financial instruments referred to herein. All information provided in this document is believed to be accurate. However, Advantage Data and its sources make no warranties, either express or implied, as to any matter whatsoever, including but not limited to warranties of merchantability or fitness for a particular purpose. Opinions in this document are subject to change without notice. Electronic redistribution, photocopying and any other electronic or mechanical reproduction is strictly prohibited without prior written permission from Advantage Data Inc.

.png?width=620&name=unnamed%20(87).png)
.png)


