

In this summary Advantage Data aims to highlight the challenges faced in sourcing and utilizing market data for valuation of illiquid and middle market loans. We will consider the overall methods of aggregating and applying data to loans in this space and how the issues surrounding the lack of readily available information can be overcome.
First, we must understand that the valuation process for illiquid, direct, and middle market securities differs greatly from their liquid counterparts.
Even in markets where established data infrastructure is limited, such as syndicated loans, reliable sources of data that are indicative of a liquid security’s value are available through market data vendors and broker quotes. When evaluating illiquid securities like middle market or directly originated loans, the effort of data aggregation becomes much more difficult and is often assumed to be an exercise in futility. We would disagree.
The hunt for data on loans with limited liquidity begins in the same place as their liquid counterparts - searching for recent trades or broker quotes. Initial sourcing efforts, however, need to go beyond tapping bulge bracket trading desks for individual prices to include desks focused on middle market or illiquid securities and databasing all runs daily. Trading desk quotes are valuable secondary observations on the specific security being evaluated but also, as we will see later, are integral in the creation of benchmarks and indices used in evaluating other securities as well. For this reason, we aggregate all trader runs rather than polling desks for individual quotes. Don’t pull an individual needle out of
a haystack of valuable data points. Grab the whole stack and use it later.
Trade and origination data can also be difficult to find as this information is not public however this data can often be extrapolated from public filings such as BDC quarterly releases. By databasing BDC investment history and back-testing previous quarters, ADI identifies newly entered positions and can back out primary or secondary market activity for a given security. To put it simply, when a new position is identified we have either a newly originated loan or an entry on the secondary market to use as a data point.
REQUEST A FREE TRIAL TO ADVANTAGEDATA TODAY

Most of these filings are released weeks after their valuation date, so why is this helpful in the valuation process?
When evaluating these securities with limited to no liquidity, there often arises a disconnect between a broker quote and an appropriate fair valuation. This is caused by skepticism on whether these quotes are in fact actionable and indicative of fair value. Similarly, when a loan originated directly or by a small club of lenders meets the secondary market it is often the result of stress for either the holder or issuer which may cause the quote to not be truly indicative of fair market value. Adding historical fair valuations from multiple parties gives us contextual data in the form of primary and secondary market activity to either bolster or discredit the broker quote in question.
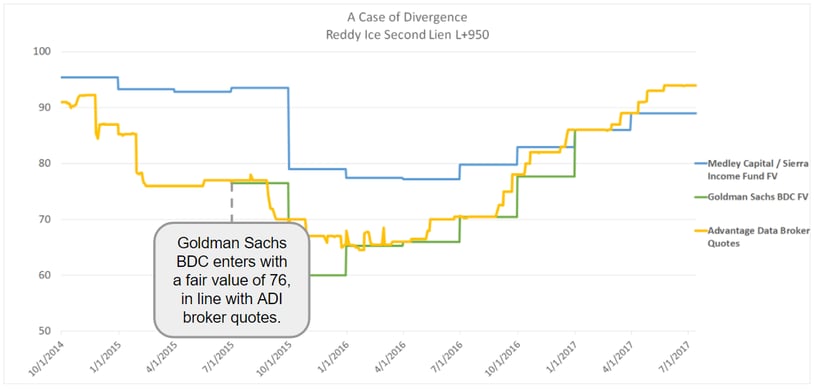
An example of this can be seen by comparing BDC valuations and broker quotes on the Reddy Ice Second Lien L+950.
Pictured below is a time series of BDC fair value marks and aggregation of broker quotes from Advantage Data on a Reddy Ice Second Lien Note. Given the limited liquidity in this name, an evaluator will have a degree of skepticism when looking at any individual broker quote and will need to validate the prices received from these desks. When compared to Medley and Sierra (blue) there is a widening gap from origination through 2015. In Q2 2015 this loan appears in Goldman Sachs BDC (green) public filing for the first time marked at 76. We infer that this is a purchase on the secondary market and thus validates our broker quotes as actionable. Leveraging the full history of broker quotes allows us to corroborate the current desk marks in ways we couldn’t before by simply polling desks for single prices on the valuation date. The incorporation of the Goldman Sachs BDC entry solidifies the desk quotes in the 70’s and gives color to the valuation process.
What if there is no secondary market activity and broker quotes are non-existent?
The approach then shifts to harnessing the primary and secondary market data we’ve gathered to provide specialized model inputs tailored based on asset type, industry, and other characteristics of the security.
All the aforementioned middle market new issuance and broker quote data can be brought together to form specialized indices, benchmarks, and other inputs only using data of like securities. This is where the focus on middle market data aggregation proves most beneficial. The broader the initial data set, the more specialized the benchmarks and matrices can be while maintaining an adequate sample size.
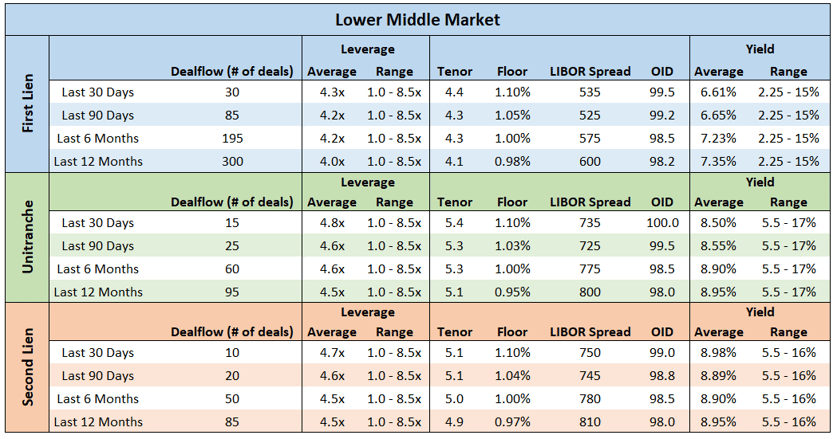
Below is an example of how a broad data set of middle market loans can be adapted to produce granular benchmarks on opaque niches of the market. Despite apparently sparse information, benchmarks can be made of private loans in the lower middle market using this aggregation method. Data that is generally unattainable outside of in-house databases such as leverage multiples is now available, even for unitranche.
Why make these benchmarks out of difficult data sets instead of using the lower end of the liquid market? When comparing these specialized benchmarks to broader market indicators that include large cap, liquid loans it becomes obvious that they do not necessarily move in parallel (and sometimes not even directionally) with the illiquid and middle market loan indicators.
Similarly, dislocation from broader market trend is a cornerstone of the pitch for the direct lending asset class, so shouldn’t it also be a part of the valuation process of those supposedly uncorrelated securities?
To put this claim in perspective, we’ll compare yields of liquid syndicated loans and middle market loans over the last year. The credit market as a whole has transformed in the last twelve months
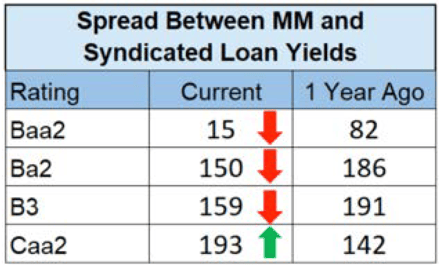
to an environment dominated by yield/spread compression. These broad trends, however, do not apply to all markets and all credits equally. According to Advantage Data’s syndicated and middle market analytics engine that tracks 7,500+ loans, the decreases in yield seen in syndicated and middle market loans were not parallel. This is most apparent when comparing the yield premium of syndicated and middle market loans today to one-year prior.
One year ago, the difference in average yield between Baa2 syndicated loans and Baa2-rated middle market loans was 82bps. That gap has narrowed to only a 15bps premium today. In this case we’ve seen more compression in middle market loans than syndicated loans of the same rating. On the other end of the ratings spectrum, we can see an increase in the premium between middle market and syndicated loans over the last year in the Caa2 rating category. The difference between the yield of a middle market and syndicated loan increased from 142bps to 193bps over that same period.
This data illustrates that while a broad sweeping trend such as spread compression certainly impacts both syndicated and middle market loans however these forces do not always result in parallel movement.
Large liquid loans and smaller illiquid credits react at different rates with varying magnitude. When using indices and benchmarks from internal databases or external market data sources, it is crucial to not let uncorrelated market movement bleed into valuation models. To put it simply, lower-rated liquid loan data is not a suitable substitute for sparse illiquid inputs.
.png)


