
BDC COMMON STOCKS
Range Bound
We’re committed to writing a weekly assessment of where the BDC common market stands because a lot can happen in a short time.
Miss the signals of a change in market direction and investors can fall behind/miss out in just a few days and not have another opportunity for months or even years.
We don’t have to look far back in time for a helpful example.
Between December 24, 2018 and January 10, 2019 BDCS – our proxy for the sector – moved up more than 10%.
That’s a whole year of dividend income in 12 business days.
Bad Old Days
Back in the Great Recession – when the all-clear sounded to some investors – Ares Capital’s (ARCC) stock price jumped over 60% in a 20 day period, as this chart reminds us.
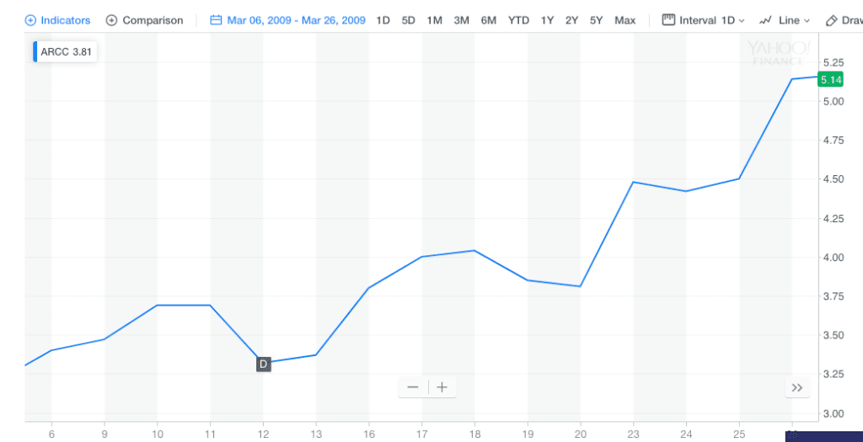
In fact, if you’d bought ARCC at its lowest point and sold at a market height a couple of years later – just before the Euro crisis – you’d have made 8x your money just from price appreciation alone.
No wonder we’ve seen some opportunistic hedge funds move in and out of the sector over the years, searching for targets of opportunity during time of crisis and self doubt.
Every Two Years On Average
By our count there have been 5 five periods in the past ten years: 2009, 2011, 2014, 2016 and 2018.
Just as much as the upsides can be very pronounced, the market downsides can be equally severe.
We were severely buffeted by the Euro-crisis of 2011 before we fully understood how a far away crisis that had nothing to do with US leveraged lending could result in drastic BDC price drops.
Memory Lane
At the time BDCS had recently been launched, which allows us to measure the impact sector-wide.
In one week (August 2-August 9) seared in the BDC Reporter’s memory, BDCS dropped by (20%).
This at a time when BDC balance sheets, credit performance and dividend outlook were all improving, two years after the end of the Great Recession.
At that point what was happening in Greece was more important than what was happening on Main Street USA.
Slump
Nor are all the downturns short, sharp shocks followed by a swift rebound, as turned out to be the case in 2011 and 2018.
On July 1, 2014 BDCS began what was to be a 19 month almost uninterrupted decline, as this chart shows:
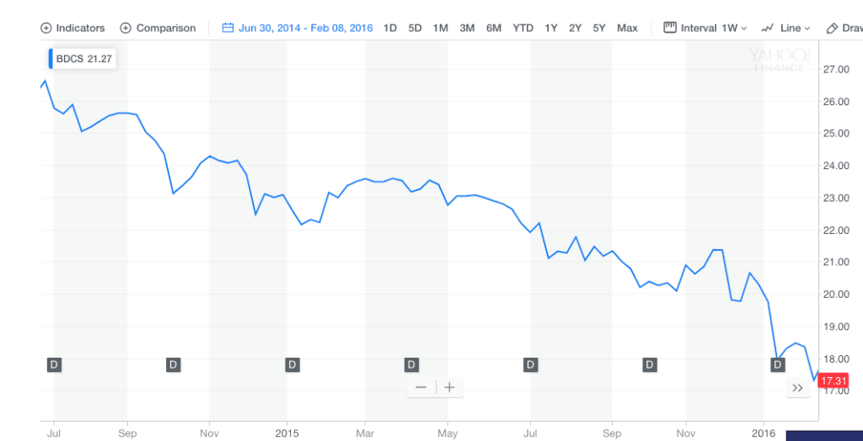
BDCS dropped about a fifth over the period that began – coincidentally or otherwise – on the very same week as oil prices began their descent from over $100 a barrel.
The sector’s exposure to energy had been quietly growing for several years – even though those type of assets are the Poster Children of inappropriate commodity-linked lending.
Two years of loss, restructuring and repositioning followed that is not complete to this day.
Reason Enough
From the BDC Reporter’s perspective, the Euro-crisis episode was the compelling reason for this column – which we’ve writing in some form ever since, whether for ourselves alone or our readers.
We’ve never regretted this microscopic approach to market movements even if we’ve not always called every rally and slump right.
At the very least we feel we’re asking the right questions and have some sense of what is going on.
Not The Same
However, all that to say, is that the BDC sector is not all Sturm und Drang.
There are often long periods when the sector is becalmed and not much is going on from a price standpoint.
We have been in just such a period for nearly 6 months now, as this chart of BDCS from early March shows:
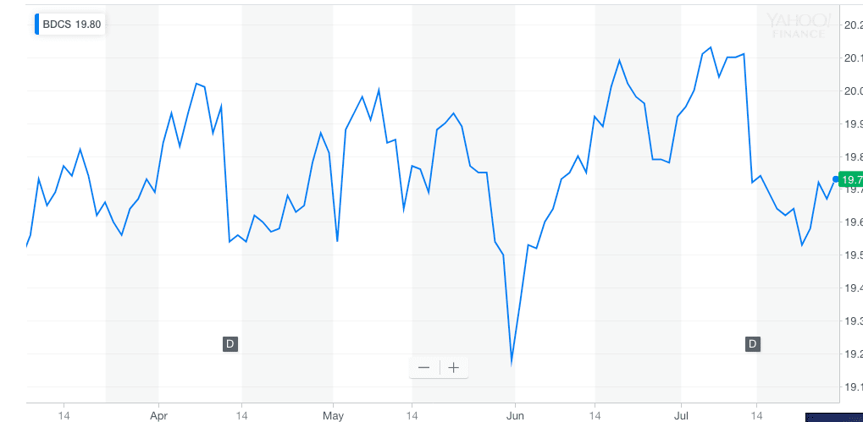
The price of BDCS has fluctuated over a 5% range (3% if we except one brief period of alarm).
That’s a very narrow channel.
When the sector is going haywire a 3% move is possible within 24 hours.
All Quiet
This week was yet another episode of not much going on.
BDCS was up 0.3% after having been down (0.3%) the week before and essentially end up in the same place as two weeks ago.
33 of 46 stocks were up in price but the week before only 14 were up and 31 were down.
This week no one BDC was up 3.0% or more in price.
Week’s Losers
There were four BDCs that dropped more than (3.0%) : OHA Capital (OHAI); Medley Capital (MCC); Portman Ridge Finance (PTMN) and Capitala Finance (CPTA).
OHAI is a perpetually thinly traded and volatile stock, though there was nothing this week that we know of that to cause the (6.1%) movement.
There are some investors dedicated to tracking a couple of key energy investments left in the BDC’s portfolio, and developments therefrom can sway expectations.
Then there’s, MCC – which is an inductee to the BDC Stock Volatility Hall Of Fame – which was down (6.0%).
Maybe investors are reading the settlement reached with the BDC’s Israeli Baby Bond investors – exclusively discussed by the BDC Reporter – as a negative sign.
In any case, MCC is now threatening to drop – once again – to a new all-time low.
PTMN has multiple credit problems that began on April 1.
Since then – and a perfect illustration of how much a BDC stock can lose value in a short time – has dropped nearly (40%) ever since.
The coming IIQ 2019 earnings release (date not yet set) may determine if more bleeding out is likely or PTMN will stabilize.
We’ll be writing our enhanced Earnings Preview for PTMN once a reporting date is set.
We’ve been busy updating the numbers and writing the commentary for the BDCs reporting results starting on July 29, when Earnings Season kicks off with Oxford Square (OXSQ).
Topping Out ?
Finally, CPTA has been moving up in price all year – as investors confidence returns.
The higher the stock moved, the more likely a profit taking reversal might occur, which seems to have happened when the stock reached a $9.99 intra-day high on July 16.
CPTA has fallen back to $9.50, a nearly (5%) drop.
Much of what happens next depends on what its results look like when revealed on August 5 and get discussed on August 6.
(The content of the Conference Call can be as consequential as the earnings release).
No Crystal Ball. Sadly.
Having major price moves just before a quarterly earnings period is not surprising and there may be more individual stock fluctuations for the next week or two in advance of results being published.
Guessing who is going to get the pre-emptive drop or pre-emptive increase is beyond the BDC Reporter’s ken, much to out dismay.
Sticking To Our Story
Nonetheless, all these downside fluctuations experienced this week do not change our depiction of the BDC sector as being caught in a narrow pricing range, and where little changes from week to week.
For example, this week 15 BDCs traded in price above book value, essentially the same as last week and many weeks before now that Owl Rock Capital (ORCC) has been added to both the BDC universe and the above NAV list.
That newest public BDC will be reporting results on July 30, and we’ll be learning much more.
Trigger
So what might cause the BDC sector to break out of price stasis ?
We’ve said in recent weeks that BDC earnings season might compel greater individual price fluctuations, especially as more than usual has been happening in the world of credit problems.
Plus, there’s the SBCAA causing many, many BDCs to be leveraging up.
Somewhere Out There
However – and to circle back from where we began – the truly monumental moves in BDC sector pricing that we’ve experienced in the past have ALL been caused by shifts in sentiments in the broader markets rather than in BDC fundamentals alone.
We may see the BDC sector moving up or down – once all the results are in – in a more pronounced manner than we’ve seen since March.
However, double digit percentage changes in BDC prices will – most likely – need some exogenous force to occur and to once again palpably justify the BDC Reporter’s constant inspection.
.png)


