
BDC COMMON STOCKS
Surprising
Notwithstanding the absence of any BDC sector news, prices continued to rise for a fourth week in a row.
As of September 13, 2019 the UBS Exchange Traded Note with contains most of the 46 public BDCs we track – and which has the ticker BDCS – closed at $20.08.
That was 1.75% higher than the week before.
Likewise, that other barometer of BDC price performance – the Wells Fargo BDC Index – reached 2,793.76.
BDCS is not at a record level, but the Wells Fargo measurement – which provides a “total return” – was again at a new year-to-date high for a second week in a row.
Comparatively Speaking
At this point BDCS – a good proxy for BDC prices – is (1%) off the February 2019 YTD high, and (5.4%) behind the highest level reached in 2018.
From its recent lowest point on August 5, 2019, BDCS is now up 5.0% and back in rally mode.
To The Data Room
Let’s look at the rest of the data that we collect weekly to confirm this market direction:
This week 36 individual BDCs were up/flat in price and 10 down.
Using the 50 Day Moving Average, we find 28 above that level and 18 down.
The 200 Day Moving Average is not much different, with 26 trading above and 20 below.
Also notable, 7 BDCs this week were up 3.0% or more.
That’s the highest number since a week in June and another in April.
We’ve also seen the number of BDCs trading above book – a metric that rarely sees much change from week to week – increase to 16 from 15.
Moreover, the number of BDC stocks trading within 5% of their 52 week highs has jumped in just one week from 8 to 11.
Just for a sense of perspective, we note that in the week ended 8/23/2019, there were just 6 BDCs pushing the price envelope.
Four weeks ago there were 5 BDCs trading within 5% of their 52 week low, and now we have only 2 to point to.
(Those are BlackRock Investment -BKCC- and PennantPark Investment -PNNT).
Question Mark
Of course, the $64,000 question is why has the BDC sector – which was headed nowhere for several months – getting into rally mode ?
Certainly, nothing much happened in the BDC landscape last week to justify the renewed enthusiasm.
One And Only
On September 10, 2019 we closed second quarter earnings season with Investcorp Credit Management’s BDC (ICMB) fourth quarter and full fiscal year results.
The BDC is the former CM Finance (CMFN), and has a new external manager but the same managers as before.
Name change or not, the small sized BDC with just $306mn in portfolio investments saw Net Asset Value Per Share drop (5.7%).
What’s more, ICMB was the Biggest Loser in price terms during the week: (3.0%).
So that wasn’t the cause of the market shift or the results the week before that of that other late-filer Prospect Capital (PSEC).
Duh
Most likely, the surge in BDC prices is related to the ongoing rally in the broader markets.
The Dow Jones Index has just completed an 8 day winning streak.
The S&P 500 was up for a third week in a row and has increased 5.54% in that period.
In the credit arena, high yield bond prices remain close to highs, despite the about-face in yields that occurred this week (which we’ll be covering in the BDC Fixed Income recap).
Here’s a YTD chart for one of the leading junk bond bond Exchange Traded Funds – HYG:
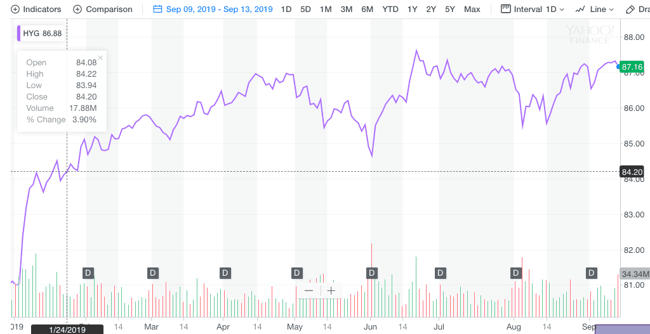
Even floating rate loans are coming back in favor – at least with retail investors, who’ve been bailing from the sector for months – as this article shows.
So this looks like a broad “everything is awesome” rally, or to use a more conventional aphorism: “”a rising tide lifting all boats”.
We’ll get a better sense next time the broader markets head southwards and see what BDCS – and the 46 public BDC stocks – behave.
Rule Changing
However – as we mentioned last week – this sudden enthusiasm amongst some investors for BDC stocks may also have something to do with the possible changes in the AFFE rules.
(AFFE= Acquired Funds Fee & Expenses).
Click here for a brief summary of the subject from Eversheds Sutherland.
Some investors in the know or making reasonable assumptions that the SEC will modify its regulations and cause institutional ownership of BDC shares to increase.
That will raise BDC prices, says the conventional wisdom, as was the situation prior to the 2014 change.
Proof Or Coincidence ?
We couldn’t help notice that both Ares Capital (ARCC) and Apollo Investment (AINV) – both BDC stocks with considerable trading liquidity and attractive to institutional buyers – hit 52 week highs this week.
We noted both high points in our Twitter feed – always on the cutting edge of such things.
Here’s a link to the tweet about Apollo Investment (AINV) on September 13, 2019.
Ares Capital (ARCC) had received a similar shout out on September 12, when hitting its 0wn 12 month and 12 year (!) apex.
As the week closed, Owl Rock Capital (ORCC) – the latest public BDC – hit a new post-IPO high price, also mentioned on our Twitter feed.
Just those “rising waters” at play or is something else tied to AFFE going on ? Or, something else again ?
A Little Bewildered
The BDC Reporter – as our name implies – is not here to judge but to pass along to our readers what the data shows.
Nonetheless, we can’t help admitting we’re a little surprised and uneasy about this recent change of sentiment where BDC prices are concerned.
The upward direction does not jibe with some BDC sector fundamentals – as revealed during the recent earnings season – and with projected results going forward.
One Step Forward. Two Back.
We recently added up all the results of BDC earnings season and found that two-thirds of BDCs (30 of 46) reported lower book value per share in the second quarter over the first quarter.
Likewise, we calculated that average BDC earnings per share are projected by analysts to increase by about 2% in 2020 over 2019, but debt might increase as much as 50%.
Flattish earnings and much higher risk do not usually argue for higher prices, even in a yield starved world.
Then there’s the fast slowing growth in borrower EBITDA and earnings – a subject that we’ll be discussing in a future article – which should be cause for concern.
Reading From Our Research
Finally – and we admit it’s not conclusive – is the BDC Reporter’s own credit review of the public BDC universe.
We look at every BDC and every portfolio company in turn to determine what their credit picture looks like and the trend since the IQ 2019 results.
It’s a Sisyphean task and we’ve only completed two-thirds of the 45 BDCs we track. (We don’t cover Newtek Business Services – NEWT- due to the nature of its assets).
Still, to date we’ve found that out of the 30 BDCs we’ve reviewed, the credit trend amongst 23 is down.
Roughly speaking that means that – on a net basis – more under-performing investments have been added and/or existing under-performers have got worse.
Not Looking Good
In terms of credit outlook going forward – by our rating system which takes into account the potential impact from under-performing assets on future earnings – we’ve rated only 6 as GOOD.
Of the remainder, 6 are FAIR and 19 are POOR.
Maybe. Maybe Not.
Only time will tell if our rating system will properly foretell future credit performance.
In a year or two we’ll have a better idea because – typically – credit problems take several quarters to unravel.
This We Know
However, we can say with some confidence – after much time spent in the credit review trenches – that we’ve seen very few under-performers pick themselves up and return to performing status without going through a bankruptcy or restructuring.
Once a company joins the rank of under-performers, getting out unscathed is very hard.
Unfortunately, the number of under-performing BDC portfolio companies appears to be growing quietly, but steadily.
From The Horses Mouths
If you don’t believe us, then there’s the BDCs themselves.
Not every BDC undertakes a quarterly investment rating of its portfolio, dividing up assets between performing and varying degrees of under-performing (like the BDC Reporter) but many do.
So far, we’ve identified 29 BDCs that supply this information – typically in their 10-Qs, but sometimes in their earnings press release.
We compared the value of their under-performing assets in the IIQ 2019 to the IQ 2019.
We found 21 reported lower values, 2 were pretty much the same and 6 were up. (Even that last category can be misleading – the result of large realized losses taken).
Impact
For a third of these BDCs under-performing assets represented 30% or more of net assets at June 2019.
Or, in other words, if just those assets get written off, the impact on book value could be material.
Nothing Is For Certain
None of this is to suggest a coming BDC credit apocalypse.
BDCs are very good at managing themselves through difficult credits and – as we’ve seen – market conditions remain very favorable which helps with “work outs”.
We’re just surprised that analysts and investors could be bidding up prices in the face of these broadly based and increasing credit risks.
Keeping It Interesting
That’s what makes the financial markets so interesting and frustrating for the BDC Reporter and – we assume – most of our readers.
We’ll be watching with great interest what happens going forward, both with an eye on the next few weeks but also several months out.
Are we reading the tea leaves wrong – or the wrong tea leaves ? Or are we just early ?

.png)


