
Summary
- On one hand, BDC index prices moved up again. On the other hand, other data we use to measure investor enthusiasm for the BDC sector was unmoved.
- We seek to reconcile this contradictory picture, while looking forward.
BDC COMMON STOCKS
Hedging
We warn readers in advance: this is going to be an ambivalent article.
There’s going to be much of that “one one hand this” and “on one hand that”.
There may even be a reference to the famous glass which people view differently.
You Were Warned
Let’s start with the part where the glass seems half full.
The BDC sector – as measured by the Wells Fargo BDC Index – reached a new 2019 high at week’s end.
The index closed at 2,738.23, a 0.26% increase over the week before, which provided the earlier 2019 high point from a “total return perspective”.
(We’re not discussing the UBS Exchange Traded Note with the ticker BDCS – our usual measuring tape for BDC price change – because this was a dividend paying week).
More Water In The Glass
Also, a healthy 28 individual BDCs were up in price or unchanged and 17 were down.
There was 1 BDC up 3.0% or more, another of our weekly data tests.
Last Shall Be First
That major mover was Medley Capital (MCC): up 4.6%.
Last week we did suggest that there are signs that the Medley organization – which has been remarkably quiet for weeks and weeks – is still planning its three way merger.
That may have attracted speculative buyers back into the non-dividend paying stock after the troubled and mysterious BDC.
Still, the real beneficiary if a deal gets done will be Medley Management(MDLY), and that stock price moved up only modestly in the week.
Speculating About Speculators
That could imply speculator confidence is not that high or that MDLY shareholders might have to make some big concessions to get this merger closed.
There’s just no way to know with a complete news black-out from all parties that would make North Korea proud.
(We checked the SEC and press release disclosures of both MCC and MDLY one more time to be sure and found nothing published since June 11).
We don’t even know if the Israeli bond holders accepted the semi-generous offer discussed by the BDC Reporter last week, or are negotiating or what.
On The Other Hand…
Nevertheless, much of the rest of the data – like last week – suggested a BDC sector mostly immobile rather than perking up.
Offsetting the one BDC up 3.0%, there were two down greater than (3.0%).
Newtek Business (NEWT) led the way down at (4.3%).
That does not tell us much as NEWT has been an investor favorite of late: up 9.3% and one of the BDCs we project will increase its pay-out in the next 12 months.
More ominously, Monroe Capital (MRCC) was off (3.7%) on the week, and is down (4.5%) over 1 month and (16.9%) over a year’s time.
Despite maintaining its dividend unchanged since going public, MRCC seems to have lost investor confidence in the spring of 2017, which has not been regained even two years plus later.
This is illustrated in the chart below which shows the stock price dropping by 30% between April 2017 and last Friday’s close:
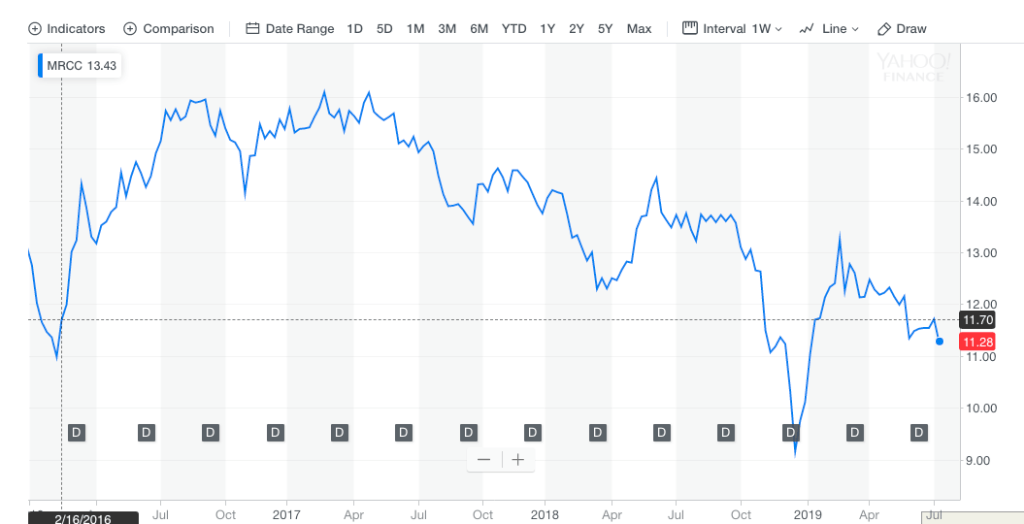
As you’d expect MRCC trades at a discount to book value and offers a 12.4% yield.
Controversially, the BDC Reporter’s Dividend Outlook for the twelve months ahead is for distributions to be UNCHANGED while the market – judging by that double digit yield – expects a cut.
Our rationale is that MRCC will offset possibly lower income from bad debts by boosting balance sheet size thanks to the SBCAA.
In this regard they’re not alone. A number of BDCs that we have pegged in the same UNCHANGED category would be in the AT RISK or DECREASE column where it not for the SBCAA.
BDCs can play that game only so long till leverage ceilings are reached and then the downward slope is sharper.
Back To The Main Road
Anyway, we also notice that the number of BDCs trading above the BDCS 2019 high set in February continues unchanged at 14.
Like last week, the number of BDCs trading above book value is also stuck at 14.
Furthermore, the number of BDCs trading within 5% of their 52 Week High dropped to 11 this week from 12.
Moreover, there is very little change in the count of BDCs trading over their 50 Day and 200 Day Moving Average: +1 in each group.
Outlook
As we said last week, we might have to wait till BDC earnings season to see which way investors are going to jump.
This week – as last – the BDC sector seems to be treading water.
We also wonder how much of BDC price momentum is a reflection of record breaking stock markets.
This chart shows how the BDC sector has moved in priced since February 22, 2019 – when BDCS peaked – compared to the S&P 500, which just reached its 52 week high on Friday.
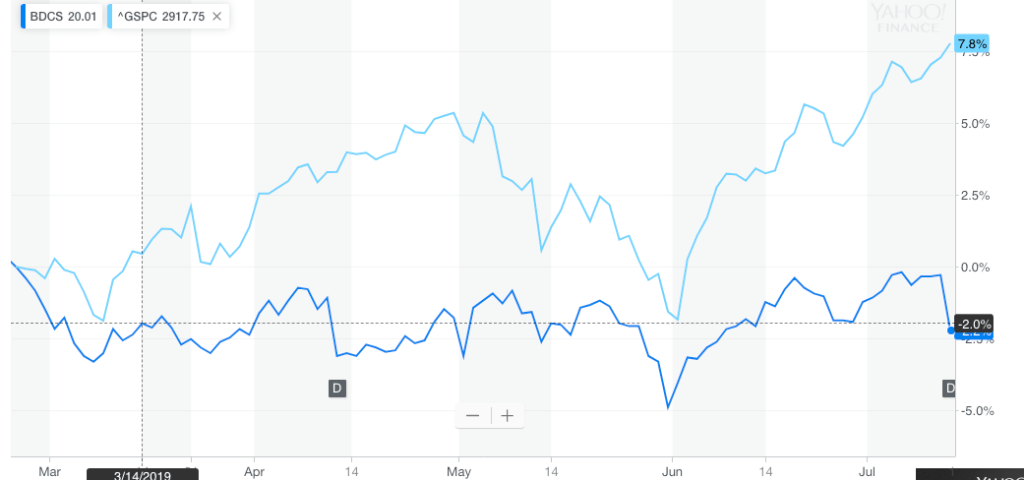
We wonder how BDCS would have performed if the S&P had been (7.8%) down over this period rather than up ?
.png)


