MARKET RALLY MARCHES ON ? : The BDC sector – as measured by the BDC Wells Fargo Index – was up 2.7% last week, reflecting a broad based rally across the 45 public companies tracked. That was the second week in a row that the BDC sector headed up in price, following 5 consecutive weeks of descent that ended the prior rally which had begun in March 2018.
BDC Preview: Week Of November 12 – November 16, 2018
Topics: Loans, Middle Market, market analytics, Finance, BDC Filings, Fixed Income, News, bdc reporter
BDC Common Stocks Market Recap: Week Ended October 19, 2018
BDC Common Stocks
Bleeding Stopped
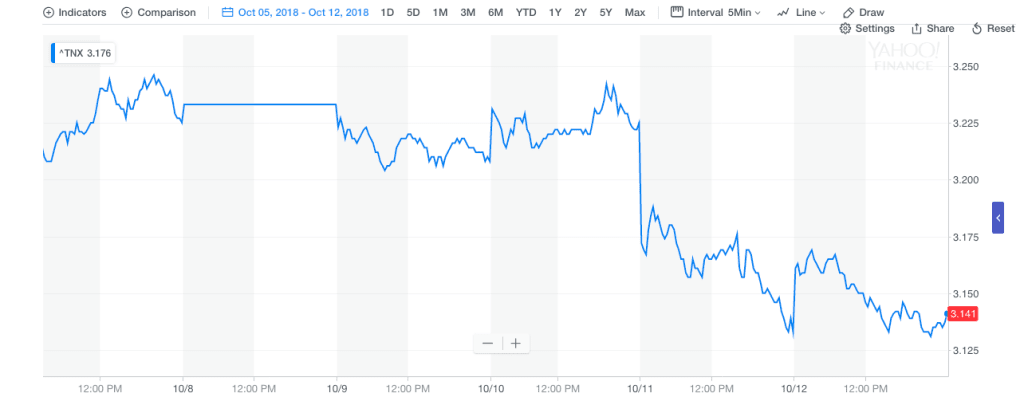
In the wider markets, the dramas of the past couple of weeks continued through October 19, 2018. “The S&P’s lower close on Friday marked the tenth down day in the past 12 trading sessions”, according to Yahoo Finance.
BDC common stocks, though, generally consolidated after weeks of decline. The UBS Exchange Traded Note with the ticker BDCS, which includes most of the individual players in the sector on a weighted adjusted basis, dropped to $19.39 from $19.40. The Wells Fargo BDC Index – more useful as a Total Return measuring stick than just the price change at BDCS – dropped to $2,505.24, down 0.42%.
Topics: Middle Market, Analytics, BDC, market analytics, business development company, Finance, sears, Fixed Income, News, bdc reporter, bankruptcy
BDC Common Stocks Market Recap: Week Ended October 12, 2018
BDC Common Stocks
Singing The Blues
As the lesser know Sonny Curtis song goes “We fought the tape, and the tape won”. Last week (ended October 5) , the BDC Reporter injected a note of optimism after a bad week for the BDC sector in which the Wells Fargo BDC Index dropped (1.4%). However, we’re not yet convinced that this current malaise will last all that much longer, bringing down BDC prices to correction or bear market levels. We can’t speak to general market sentiment which – as they say – is “going to do what it’s going to do”.
We’ve not yet been proven absolutely wrong because BDCS – which has now dropped to $19.40 after disgorging a $0.41 distribution – is down (7.8%) from its high. If we adjust for the dividend the drop is “only” (5.8%) and the “Total Return” Wells Fargo BDC Index is off just (4.5%). We are some way off a a classic 10% correction or a 20% haircut bear market.
Topics: Middle Market, Analytics, market analytics, business development company, Fixed Income, portfolio, News, bdc reporter
BDC Fixed Income: Market Recap: Week Ended October 12, 2018
BDC Fixed Income
Respite
The week ended October 12 2018 was dismal for BDC common stock investors.
Readers may not need our BDC Common Stocks Market Recap – published simultaneously with this article – to be alerted to the fact.
However, BDC Fixed Income – after enduring it’s own mini-meltdown the week before – perked up modestly on the week.
Of the 39 BDC debt issues that are actively trading (out of 40 in the universe), the median price came to $25.18.
On October 5, 2018, that equivalent median price was $25.09.
Moreover, the number of debt issues trading below par – pushed there by higher rates – dropped to 11 from 13.
Still, there were no issues trading over $26.00 – until just recently a frequent occurrence.
Topics: Middle Market, Analytics, BDC, business development company, Fixed Income, portfolio, News, bdc reporter
BDC Common Stocks Market Recap: Week Ended October 4, 2018
Tumbling Down
This was a hard week to be a BDC common stock investor.
After several weeks of ups and downs in a narrow range, BDC prices mostly moved clearly to the downside.
We’ll start as we most always do with the UBS Exchange Traded Note with the ticker BDCS, which fell to $20.361 from $20.72 the week before, a (1.7% drop).
BDCS was at $20.90 a fortnight ago, so the two week decline is (2.6%).
Likewise, the Wells Fargo BDC Index dropped (1.4%) in a week and (2.4%) over two weeks.
Topics: Loans, Middle Market, Analytics, market analytics, business development company, Fixed Income, News, bdc reporter
Are you using AdvantageData?
AdvantageData is your fixed income solution for pricing, analytics, reports, and insight on approximately:
- 500,000+ U.S. and international corporate bonds
- Over 6,200+ CDS reference entities
- Over 22,000+ syndicated loans
- Over 100 equity markets worldwide
- One platform 16 products and services from debt to CDS to loans to mid-market
- Used by top buy and sell-side firms worldwide


.png)


