Looking ahead for the week ended December 21 – and downward – the next major number to look out for is the price of the UBS Exchange Traded Note with the ticker BDCS – which we use as a quick sector proxy – and which closed Friday December 14 at $18.67. The all-time low for BDCS is $17.31, set in February 2016 following a similar market meltdown. The very fact that the BDCS price would have to drop as much as 7.3% to match that nadir speaks to how relatively well the sector has held up in the current environment – the 10%+ drop from the August 30 2018 BDCS high notwithstanding. However, that sort of implosion would not be uncharacteristic for this highly volatile sector.
Read More
Topics:
BDC,
business development company,
Finance,
Fixed Income,
News,
bdc reporter

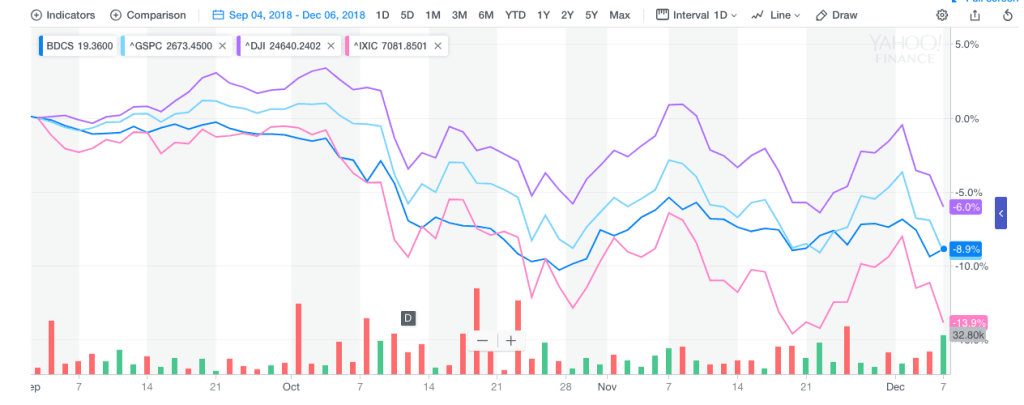
Inescapable: We’re going to assume the ups and downs of the major indices – and the corresponding movement in BDC common stock prices – will continue until it doesn’t. Since late August, the turmoil across all asset classes has caused the playbook of BDC fundamentals to be thrown out the window as new low after new low is reached, with a few head fakes along the way. As we write this the Dow Jones index is trading 200 points down in the Monday pre-market, which only means that more of the same is on the cards. Admittedly, this past week, the BDC sector fared less poorly than the 3 major indices (Dow Jones, NASDAQ and S&P 500), but that could reverse itself this week, whether the broader markets go up or down. All we are sure of is that the BDC sector cannot disentangle itself from whatever direction the markets are headed. Here is the chart showing the price of the UBS Exchange Traded Note with the ticker BDCS – which includes most every BDC player – since August 30, 2018, roughly when the market dramas began, compared to the main indices.
Read More
Topics:
Middle Market,
BDC,
market analytics,
business development company,
Finance,
Fixed Income,
News,
bdc reporter
Analyzing PIK and Coupon Spread changes can be a great way to identify middle market companies that are beginning to feel pressure from lenders. Whether you're sourcing investments, consulting distressed borrowers or analyzing BDCs, utilizing alternative signs of distress as leading indicators is a great way to get ahead of the market - Download the data sample below!
Read More
Topics:
Middle Market,
BDC,
Spreads,
First Lien,
Distressed Investments,
debt,
business development company,
Distress,
Distressed Debt,
Finance,
Restructuring,
Fixed Income,
download
Market Mayhem: As we discussed at length already in our premium BDC Common Stocks Market Recap, last week was surprising as the BDC sector – and many individual BDCs – fared much better than the main indices and all the main categories from investment grade to “junk”. However, we’d be very surprised if the BDC sector can continue to remain uncorrelated with the broader markets for very much longer. As this chart below shows – comparing the price progress of the Exchange Traded Fund SPY, which is based on the S&P 500, and the exchange traded note with the ticker BDCS,which reflect the BDC sector – the two have moved pretty much in tandem since the decline began in the markets on September 20.
Read More
Topics:
Middle Market,
Analytics,
BDC,
market analytics,
business development company,
Finance,
Fixed Income,
News,
bdc reporter
Back In The Saddle. Again.
It’s Week Two of the late 2018 BDC rally.
More than three-quarters of the 45 BDCs we track were up in price, just like the week before.
The price of the UBS Exchange Traded Note which covers most of the companies in the sector – BDCS – was up to $19.76.
That’s 2.0% on the week, and 5.0% over a fortnight.
The Wells Fargo BDC Index – which provides more of a total return picture – was up 2.7%.
Read More
Topics:
Analytics,
market analytics,
business development company,
Finance,
BDC Filings,
Fixed Income,
News,
bdc reporter


.png)


