Analyzing PIK and Coupon Spread changes can be a great way to identify middle market companies that are beginning to feel pressure from lenders. Whether you're sourcing investments, consulting distressed borrowers or analyzing BDCs, utilizing alternative signs of distress as leading indicators is a great way to get ahead of the market - Download the data sample below!
One Step Ahead: Identifying Distress In The Middle Market
Topics: Middle Market, BDC, Spreads, First Lien, Distressed Investments, debt, business development company, Distress, Distressed Debt, Finance, Restructuring, Fixed Income, download
Restructuring is often driven by market rhythms, or quantifiable circumstances like the decline of shopping at brick-and-mortar stores in favor of online shopping. An easy example of the latter is the rise in eCommerce at online stores like Amazon, resulting in the bankruptcy and liquidation of Toys R Us. Another, less common circumstance can be natural (or unnatural) disasters.
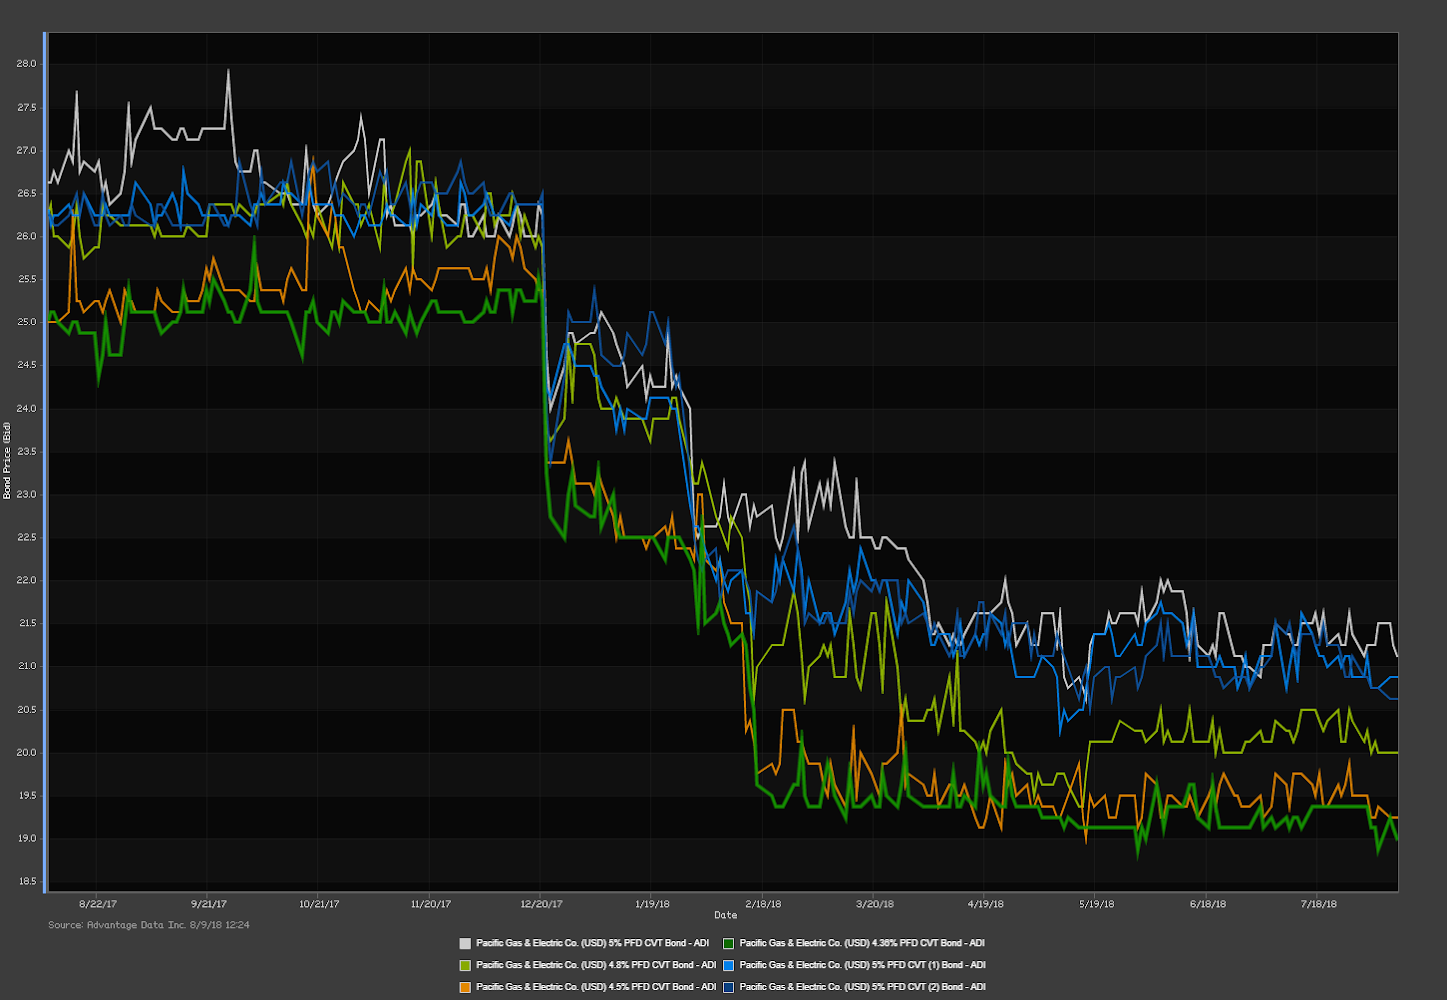
It has been reported that Pacific Gas & Electric (PG&E), a California based utility, has brought in law firm Weil Gotshal & Manges LLP to explore restructuring options after California officials found the company responsible for the deadliest wildfires in the state’s history in the fall of 2017. One option the firm is said to be exploring is breaking up PG&E and filing bankruptcy for one of the units. For companies struggling financially, sacrificing one area of a business to protect the rest from liabilities is a popular strategy. [source]
Topics: Distressed Investments, Distressed Debt, Restructuring, Fixed Income, download, default
Analysis: High Yield & Investment Grade Bonds Maturing in 3 Months
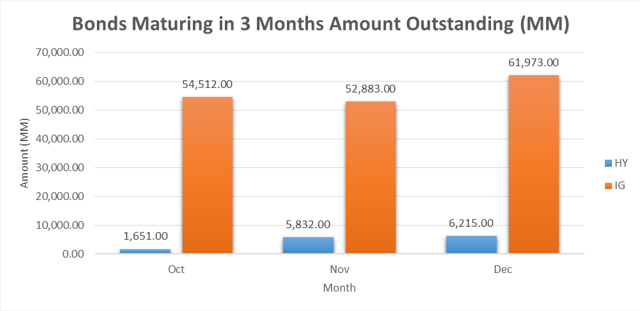
In the coming months, October – December, Investment Grade & High Yield bonds amounting to 183.1 Billion are maturing. Of the two asset classes, Investment Grade has the lion’s share of debt maturing in the next 3 months compared to High Yield.
Topics: High Yield, Investment Grade, Bonds Maturing, Distressed Investments
Analysis: Q2 2016 vs. Q1 2016 Distressed BDC Investments
Looking at $80 billion of FV AUM for 76 BDCs at Q2 2016, with the exception of internally managed BDCs, we see reductions in distressed assets (90% of par or less) across the board, whether looking at size of BDC, externally managed BDCs or senior secured and non senior investments. Internally managed BDCs saw an increase in distressed assets as a percentage of portfolio of 0.2% vs. a decrease of 2.7% for all BDC's and a 3.1% decrease for externally managed BDC's.
Topics: BDC, Distressed Investments
Are you using AdvantageData?
AdvantageData is your fixed income solution for pricing, analytics, reports, and insight on approximately:
- 500,000+ U.S. and international corporate bonds
- Over 6,200+ CDS reference entities
- Over 22,000+ syndicated loans
- Over 100 equity markets worldwide
- One platform 16 products and services from debt to CDS to loans to mid-market
- Used by top buy and sell-side firms worldwide


.png)


